












Sooner or later, a chief financial officer inevitably looks at a team’s wireframes and asks what any of it actually does for the bottom line. Storyboards do not answer that question, and the era when a brief, high-level pitch could carry a project through executive review has long since passed. In the current corporate climate, securing budget, buy-in, and organizational backing for user experience initiatives requires demonstrating that the design is provably good for the enterprise, not just for the individuals interacting with the software.
Proving that connection takes far more than simply attaching a dollar sign to a redesign. Leaders must understand how their specific organization defines value in the first place, how it measures that value, and how a credible line can be drawn between a design initiative and an outcome that executive leadership already cares about. Rather than relying on scattered tips or abstract advice, examining a comprehensive worked example illustrates how these financial bridges are built in practice.
Imagine Meridian, a mid-size business-to-business software-as-a-service company. Its hypothetical onboarding redesign carries consistent figures from initial goal-setting through cost accounting, causal testing, and the final return on investment calculation. A financial framework only becomes truly tangible when the numbers connect from one stage to the next, offering a model that teams can adapt within their own corporate structures.

Why ROI Matters More Than Ever in UX Conversations
Companies across industries now demand strict clarity on what every allocated dollar buys, and vague promises centered on delivering delightful user experiences stopped clearing that performance bar years ago. Executives do not inherently harbor a bias against user experience work; rather, they resist ambiguity. A pitch built on the premise that users will find a platform easier to navigate loses every single time to a competing department promising a measurable percentage increase in quarterly sales.
The distinction mirrors the gap between a streamlined checkout process that demonstrably reduces cart abandonment and lifts completed purchases, versus the same design work being rewarded merely because internal quality assurance testers enjoyed using it. One outcome belongs on a professional resume, while the other struggles to justify its existence in a board meeting. Earning the former requires anchoring design arguments in hard business metrics.
When Business Goals And KPIs Don’t Exist Yet
Most discussions surrounding design return on investment make a convenient underlying assumption: that the organization already owns clean, well-defined business goals and key performance indicators ready for a design project to hook onto. In reality, everyday corporate environments are far messier. Plenty of enterprises operate under broad ambitions such as growing faster or improving the customer journey without ever breaking those goals down into something quantifiable. An investment case built on that kind of ambiguity sounds impressive right up until a finance team subjects it to rigorous scrutiny.
Consequently, the first assignment for a design leader is often helping the organization define what success actually looks like. Interviewing stakeholders across various departments reveals where product teams consider quarters successful, where customer success witnesses users struggling, and where sales deals frequently stall. Listening for recurring themes across these conversations uncovers the company’s latent business objectives. A useful forcing function for this alignment is the objectives and key results model, which naturally rejects vagueness.
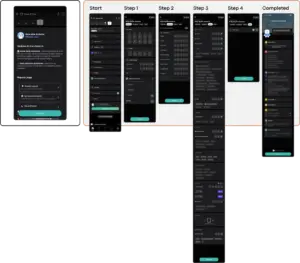
At Meridian, the initially stated corporate ambition was to improve the rate of new users adopting the platform—a target that is fundamentally impossible to design toward or measure against with precision. Internal stakeholder interviews revealed the actual shape of the problem: trial users required a median of fourteen days to reach their first moment of value, the vast majority churned before ever getting there, and onboarding questions were overwhelming the customer support queue. Out of those insights emerged a structured objective with clear edges: reduce the median time-to-first-value from fourteen days down to seven through a guided setup flow, and lift trial-to-paid conversion from eight percent to nine and a half percent.
Formalizing these metrics requires care. Imposing KPIs unilaterally from inside a design team often leads leadership to suspect the field has been rigged. Instead, co-creating these targets with the specific departments that own the outcomes prevents friction, provided the team avoids accepting unachievable goals. Meridian’s head of product agreed that setup-completion rates served as a fair proxy for onboarding usability, while customer success signed off on the time-to-first-value metric, which was already sitting on their operational dashboards.
Quantifying the Full Cost of the Investment
Every return on investment calculation features a denominator representing total costs, and this is precisely where many design initiatives falter. Calculating a return is impossible without strategic financial planning, yet project expenses are frequently limited to designer salaries or external consulting hours while ignoring everything else. A finance team will inevitably uncover the remaining expenses whether they were initially counted or not, making it vital to account for them upfront.
Direct costs are the most visible components. Meridian’s redesign incurred forty-five thousand dollars in internal design and research labor alongside an additional eight thousand dollars dedicated to software tooling and participant research incentives. Licenses for collaborative design platforms, user testing software, analytics dashboards, and participant recruitment costs all belong in the total tally. Engineering sits firmly in the same cost column because design work does not stop at static mockups. Building the guided setup required two frontend engineering sprints and a thorough quality assurance pass, totaling thirty-eight thousand dollars, alongside four thousand dollars in coordination overhead generated by new sync meetings and shared tracking dashboards.

A critical line item that teams frequently miss is stakeholder time. Workshops, design reviews, and feedback sessions pull senior personnel away from their core responsibilities. A vice president of product spending four hours a week in design reviews is a vice president not dedicating those hours to strategic roadmap planning or crucial partner negotiations. Logging attendee participation, duration, and seniority, and pricing it at fully loaded internal costs—salary plus benefits divided by productive hours—reveals a significant hidden investment. Meridian’s quarterly tally for workshops, reviews, and stakeholder interviews priced out at twenty-two thousand dollars.
Combining design labor, tooling, engineering, stakeholder time, and coordination overhead brings Meridian’s total investment to one hundred seventeen thousand dollars. Presenting this comprehensive figure establishes immediate credibility with a finance department because it mirrors the thoroughness of their own internal audits.
Proving Causation, Not Just Correlation
Most design return on investment pitches stall when leadership asks how conversion lifts were isolated from concurrent variables like new pricing structures, seasonal traffic fluctuations, or simultaneous marketing campaigns. Without a convincing answer to this causal challenge, the entire narrative collapses.
The gold standard for proving causation remains structured experiment splitting, such as running a legacy experience against a new design on an even traffic distribution until sample sizes achieve statistical significance. Meridian’s onboarding flow lent itself cleanly to a phased rollout. For an eight-week window, half of new trial signups experienced the redesigned guided setup while the other half remained on the legacy interface. The control group converted to paid accounts at eight percent, while the variant reached nine and a half percent. Across roughly six thousand one hundred trials within the testing window, the difference was statistically significant.
Where traffic splits are not feasible due to structural changes or small user bases, teams rely on continuous time-series measurement, tracking baselines steadily before implementation and comparing performance afterward. Furthermore, documenting concurrent organizational changes is an essential part of rigorous analysis. A marketing team pricing test overlapped with the middle weeks of Meridian’s rollout. Rather than ignoring the overlap, the design team explicitly chose to attribute only seventy percent of the observed conversion lift to the onboarding redesign in their final financial math, acknowledging the potential influence of concurrent work. This transparency preserves credibility in skeptical rooms.
Leading and lagging indicators further reinforce the causal chain. Meridian’s leading indicators shifted first—setup completion climbed from sixty-two to eighty-nine percent, and median time-to-first-value dropped from fourteen days down to six and a half—while the lagging trial-to-paid conversion numbers followed accordingly. Presenting the operational mechanism alongside the ultimate business outcome creates a cohesive narrative that is difficult to dismiss.
The ROI Calculation End to End
To evaluate the final financial impact, Meridian factored in its annual volume of approximately forty thousand trial signups. Lifting conversion from eight to nine and a half percent introduces roughly five hundred sixty new paying customers annually. At an average annual recurring revenue of eighteen hundred dollars per account, those customers represent about one million eight thousand dollars in new annualized revenue. Applying the conservative seventy percent attribution model trims that defensible figure down to approximately seven hundred six thousand dollars.
Weighing that return against the total one hundred seventeen thousand dollar investment yields a first-year return of approximately five to one, with initial project payback achieved in roughly two months on gross figures, or stretching to a quarter when calculated on a net basis accounting for customer churn. Additional operational savings emerged from a thirty percent reduction in onboarding-related support tickets, representing about thirty-six hundred fewer inquiries a year and saving fifty-four thousand dollars annually. Keeping these support savings as an independent line item preserves the overall integrity of the financial presentation without inflating the primary headline number.
Tailoring these figures to the specific priorities of executive stakeholders ensures the narrative resonates across departments. A chief financial officer evaluates risk, cost, and protected revenue, whereas a chief marketing officer focuses on how improvements in trial conversion rates positively impact overall customer acquisition costs. Framing the same underlying data to fit executive perspectives allows leadership to evaluate design initiatives through the operational language they use every day.
Ultimately, securing a lasting seat at the executive table relies entirely on translating creative efforts into measurable, defensible business impact. By grounding design arguments in rigorous financial accounting, controlled causal testing, and transparent assumptions, design leaders transform their work from subjective artistic endeavors into vital strategic investments that command executive respect.