










Observability is hardly a new challenge in modern software engineering, and the NestJS ecosystem is far from the first to tackle it. However, the introduction of NestJS Observe raises a specific and compelling question for developers: what happens when an observability platform inherently understands the framework it is monitoring? While traditional tooling often treats an application as a generic running process, framework-aware observability attempts to bridge the gap between application architecture and operational telemetry.
To understand the value proposition of this approach, engineers must first look at the persistent difficulties of debugging complex backend applications. When a server application slows down or behaves unexpectedly, developers are routinely forced to piece together disparate signals. Logs might show that an operation started and finished, but they rarely capture the nuanced story of a single request winding its way through controllers, services, guards, interceptors, and external database calls.
Modern applications produce a staggering volume of information, including logs, metrics, traces, profiles, errors, and background job messages. Yet, the central challenge remains remarkably simple: determining exactly what happened inside the application during a given execution path. For a NestJS application, this question carries unique potential because the framework already possesses deep structural knowledge about how its components interact.

The Core Problem of Application Observability
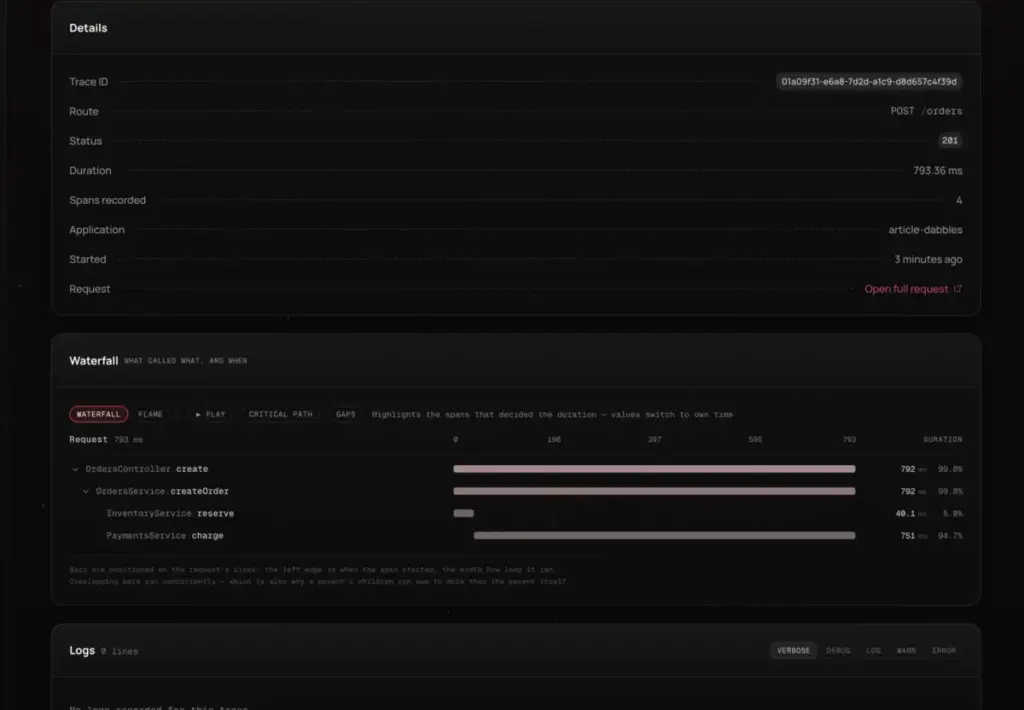
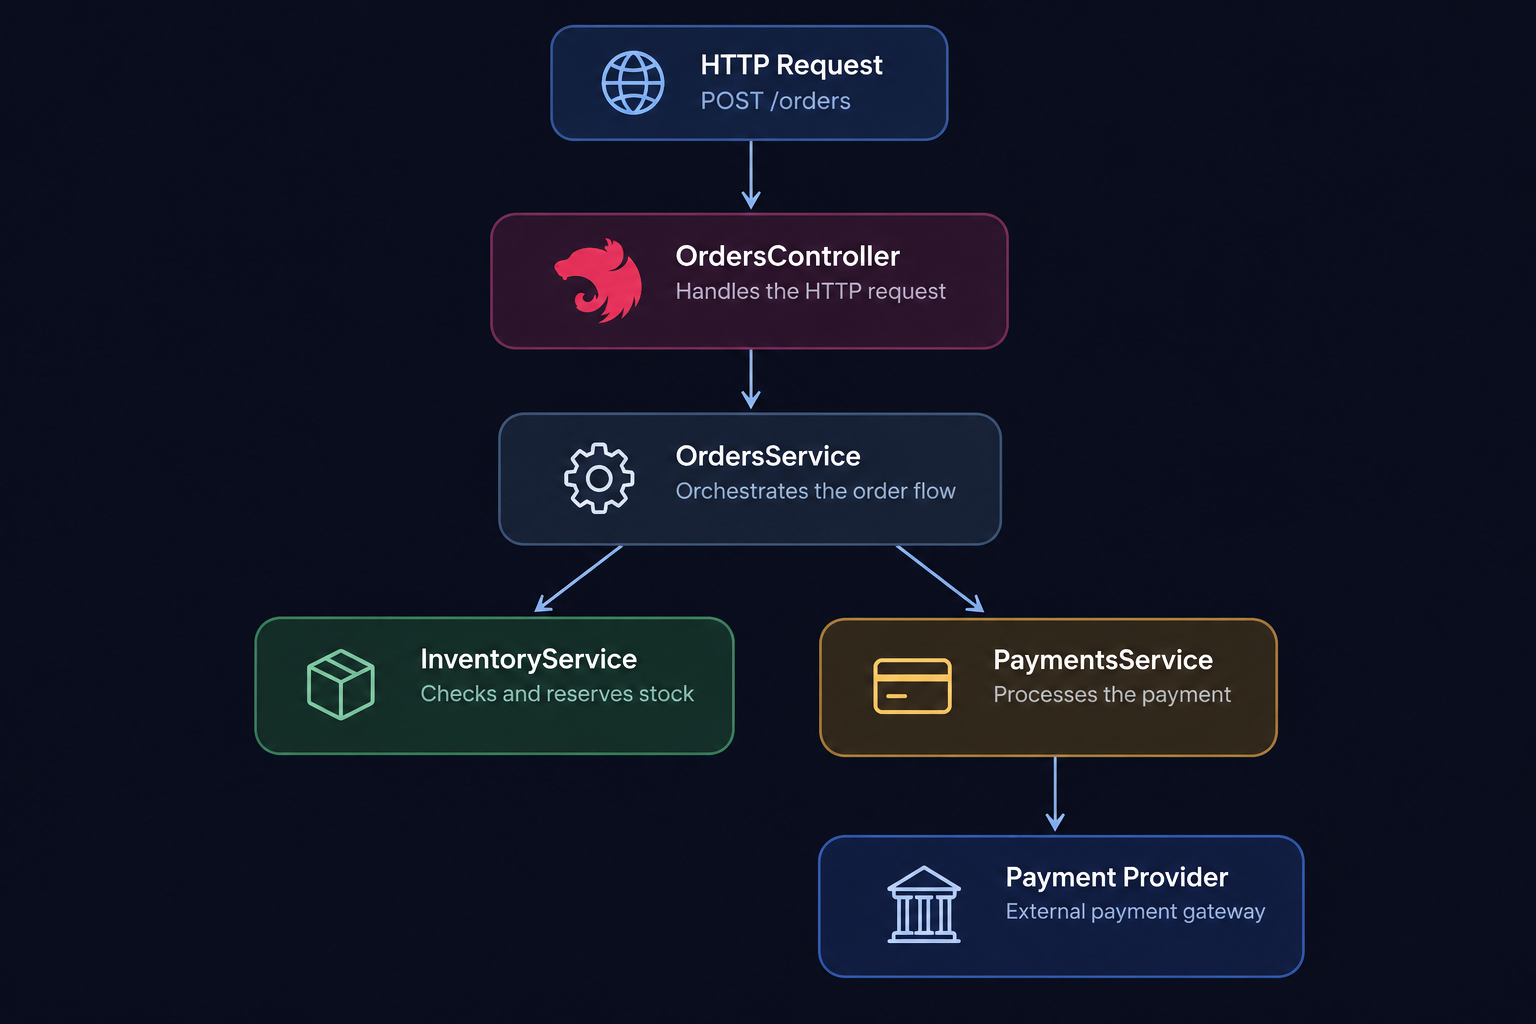
In a typical production environment, developers often encounter scenarios where a standard HTTP endpoint, such as a create-order route, suddenly takes several seconds to complete. Standard API monitoring tools might reveal the overall request duration, but they frequently leave engineers guessing about where that time was actually consumed. The delay could stem from database contention, heavy CPU cycles on the Node.js event loop, a slow third-party payment provider, or latency within an internal microservice.
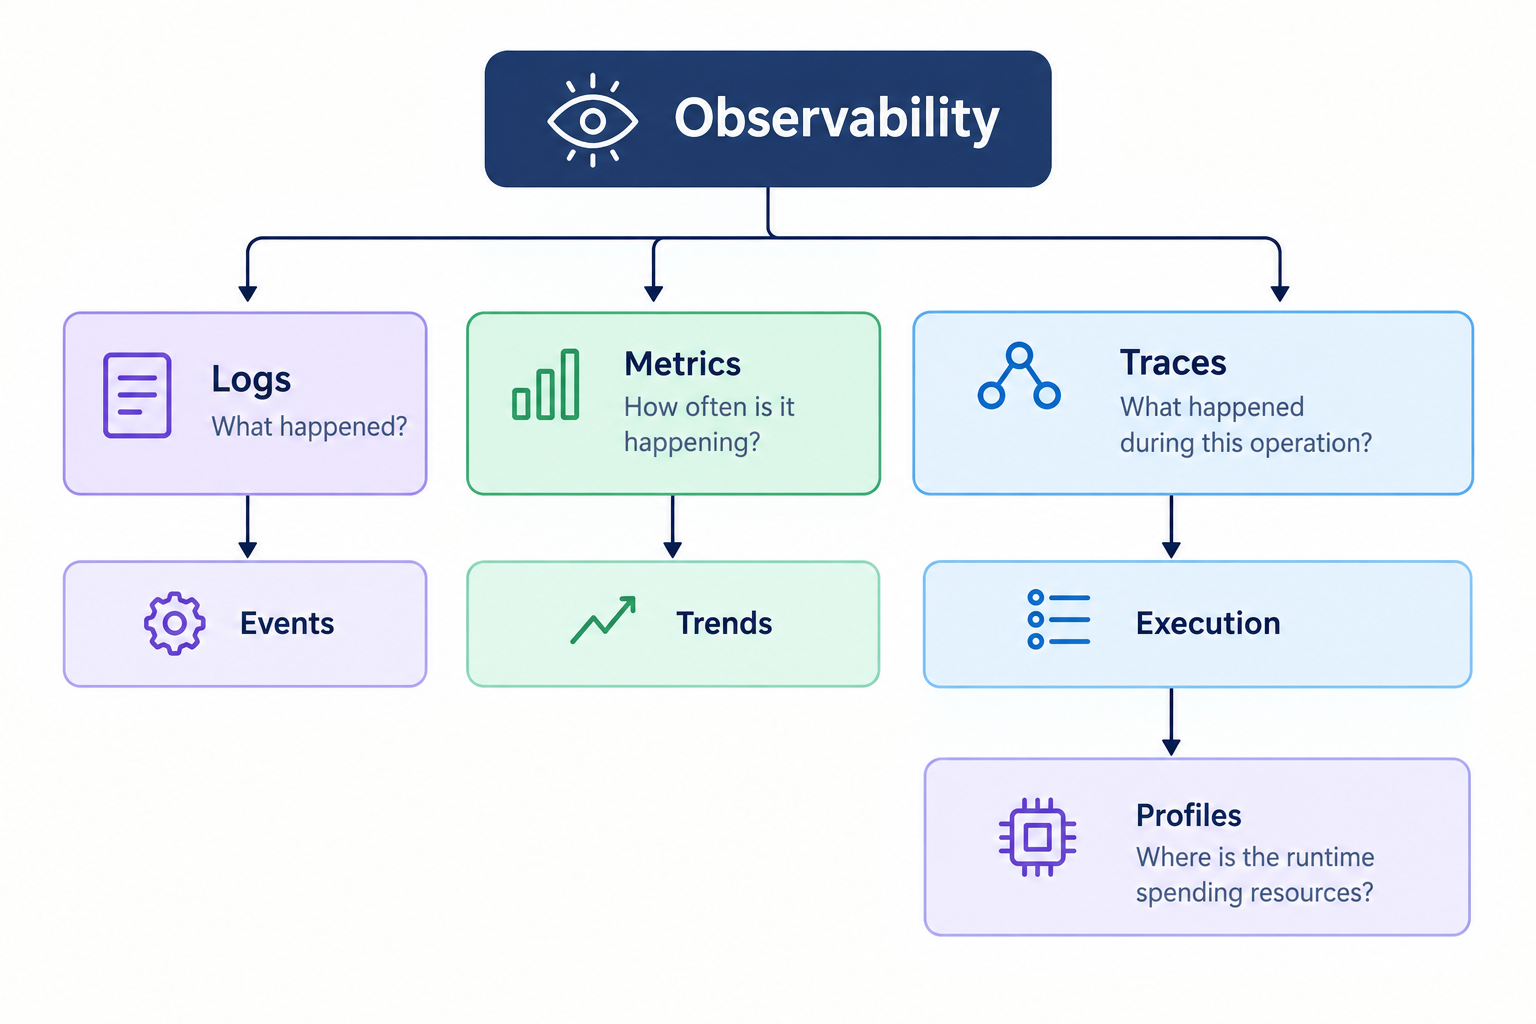
Observability attempts to solve this visibility gap by leveraging telemetry signals, which are generally divided into logs, metrics, traces, and profiles. Each signal answers a fundamentally different operational question. Logs describe discrete events, such as a payment provider returning an error status. Metrics aggregate performance data over time, helping engineering teams identify high-level trends, error rates, and latency percentiles like p95. Traces follow a single logical operation through its execution path, illustrating how individual components contribute to the total duration of a request. Finally, profiles help pinpoint where the runtime environment is spending its hardware resources, such as garbage collection or cryptographic operations.
While traditional monitoring tools aggregate these signals effectively, they typically treat the underlying application as a black box. Framework-aware observability shifts this paradigm by allowing instrumentation to leverage the application’s native structure. Instead of observing a generic JavaScript process, the telemetry layer can recognize the distinct boundaries of controllers, providers, middleware, and pipes, offering a clearer picture of request lifecycles.
The Evolution toward Framework Integration
Historically, developers have relied on a combination of basic logging, application performance monitoring agents, and standardized toolkits like OpenTelemetry to capture telemetry data. OpenTelemetry has emerged as a vital vendor-neutral standard for generating, collecting, and exporting telemetry signals across diverse polyglot environments. Its primary strength lies in portability, allowing organizations running multiple programming languages to maintain a unified telemetry pipeline.
However, generic instrumentation layers often lack the contextual awareness of specific framework lifecycles. While OpenTelemetry can capture an incoming HTTP request, it does not inherently understand that the request passed through a specific NestJS controller method, invoked a provider service, or triggered a GraphQL resolver.
NestJS Observe approaches this challenge by integrating directly with the application model. Rather than treating telemetry as an external afterthought, the official tool aims to automatically instrument various NestJS execution paths, including HTTP requests, microservice message handlers, and background queue processing. By embedding instrumentation into the framework’s core lifecycle, developers can capture runtime metrics, profiling data, and detailed traces without manually wrapping every business logic function in custom logging statements.
Practical Implications for Engineering Teams
Implementing observability in a modern backend requires careful balance. Automatic instrumentation provides a robust structural skeleton, but it cannot automatically deduce which specific business operations hold the highest operational significance. Consequently, engineering teams often supplement automatic tracing with selective manual instrumentation around critical business pipelines, such as pricing calculations, fraud evaluations, or payment authorizations.
At the same time, organizations must navigate the trade-offs associated with telemetry volume and infrastructure costs. Recording extensive trace data, high-cardinality attributes, and detailed request headers can rapidly increase storage requirements and introduce potential privacy or compliance concerns regarding sensitive data like tokens and personal information. As a result, production environments frequently implement strategic sampling rates, prioritizing 100 percent of errors and slow requests while capturing a smaller percentage of successful routine operations.
Ultimately, the decision to adopt a framework-specific tool like NestJS Observe depends heavily on an organization’s architectural footprint and operational philosophy. Teams heavily invested in the NestJS ecosystem may find significant value in the reduced cognitive overhead of viewing telemetry expressed in familiar architectural terms. Conversely, large enterprises operating diverse polyglot architectures across multiple languages often prioritize standardized, vendor-neutral frameworks like OpenTelemetry to maintain centralized observability pipelines. Regardless of the chosen tooling, the overarching goal remains consistent: reducing the time it takes engineering teams to diagnose incidents and understand the true behavior of their production systems.