










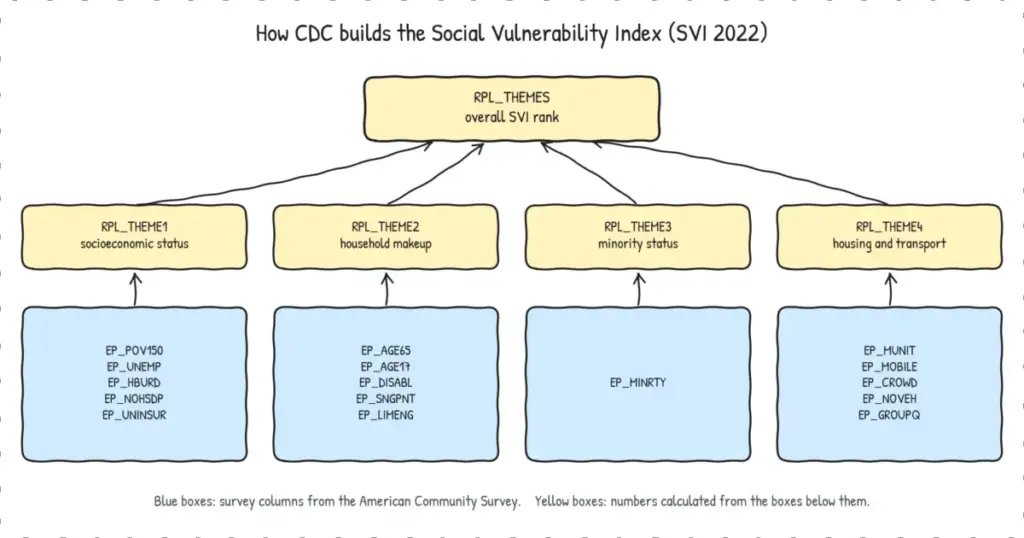
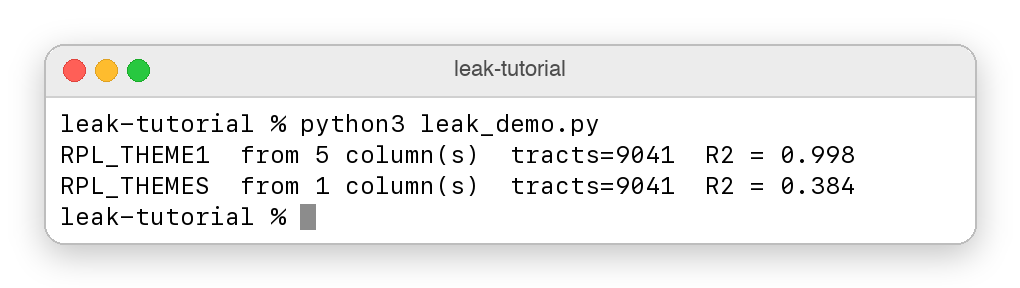
Data scientists working with public datasets often encounter machine learning models that achieve near-perfect predictive accuracy, only to discover that the high scores stem from a fundamental data flaw rather than genuine predictive power. In a recent analysis involving a public dataset from the Centers for Disease Control and Prevention (CDC), a predictive model trained on five input columns yielded an R-squared score of 0.998 when attempting to predict a sixth column from the same file.
While such a score typically indicates an exceptionally robust model, the reality was far more mundane: the CDC had calculated the sixth column directly from the other five inputs. The machine learning algorithm had not uncovered a profound real-world pattern; it had simply reverse-engineered the government agency’s proprietary arithmetic formula.
In the data science community, this persistent issue is known as target leakage. It occurs when the independent variables supplied to a model already incorporate the target variable in some form, either directly or through a multi-step calculation chain. Target leakage frequently hides in plain sight within public repositories because a substantial proportion of public data is derived from other public sources. Government indices, socioeconomic indicators, and environmental hazard scores are routinely built from survey columns, with subsequent indexes built upon those initial metrics.

Although government agencies and research organizations typically document these calculation recipes in comprehensive methodology documents, data catalogs rarely store this lineage information in a machine-readable format that automated pipelines can easily verify. Consequently, automated feature selection tools often ingest leaky variables, mistake the pre-existing mathematical relationship for a strong signal, and produce inflated performance metrics that collapse when deployed in real-world environments.
Understanding the Roots of Public Data Leakage
While simple leakage scenarios—such as finding the inputs and the final index stored side-by-side in a single comma-separated values file—are relatively straightforward to identify, real-world data pipelines frequently span multiple organizations, creating complex webs of derivation that stretch across agency boundaries.
A prominent example involves the Federal Emergency Management Agency’s National Risk Index, which incorporates a social vulnerability score into its overall risk calculations. According to technical documentation published by FEMA, this vulnerability metric originates from the U.S. Census Bureau’s Community Resilience Estimates, which in turn rely heavily on raw survey data from the American Community Survey. Consequently, a FEMA risk score and a basic census survey column can exist at opposite ends of a long computational chain, despite originating from entirely different government websites and administrative units.
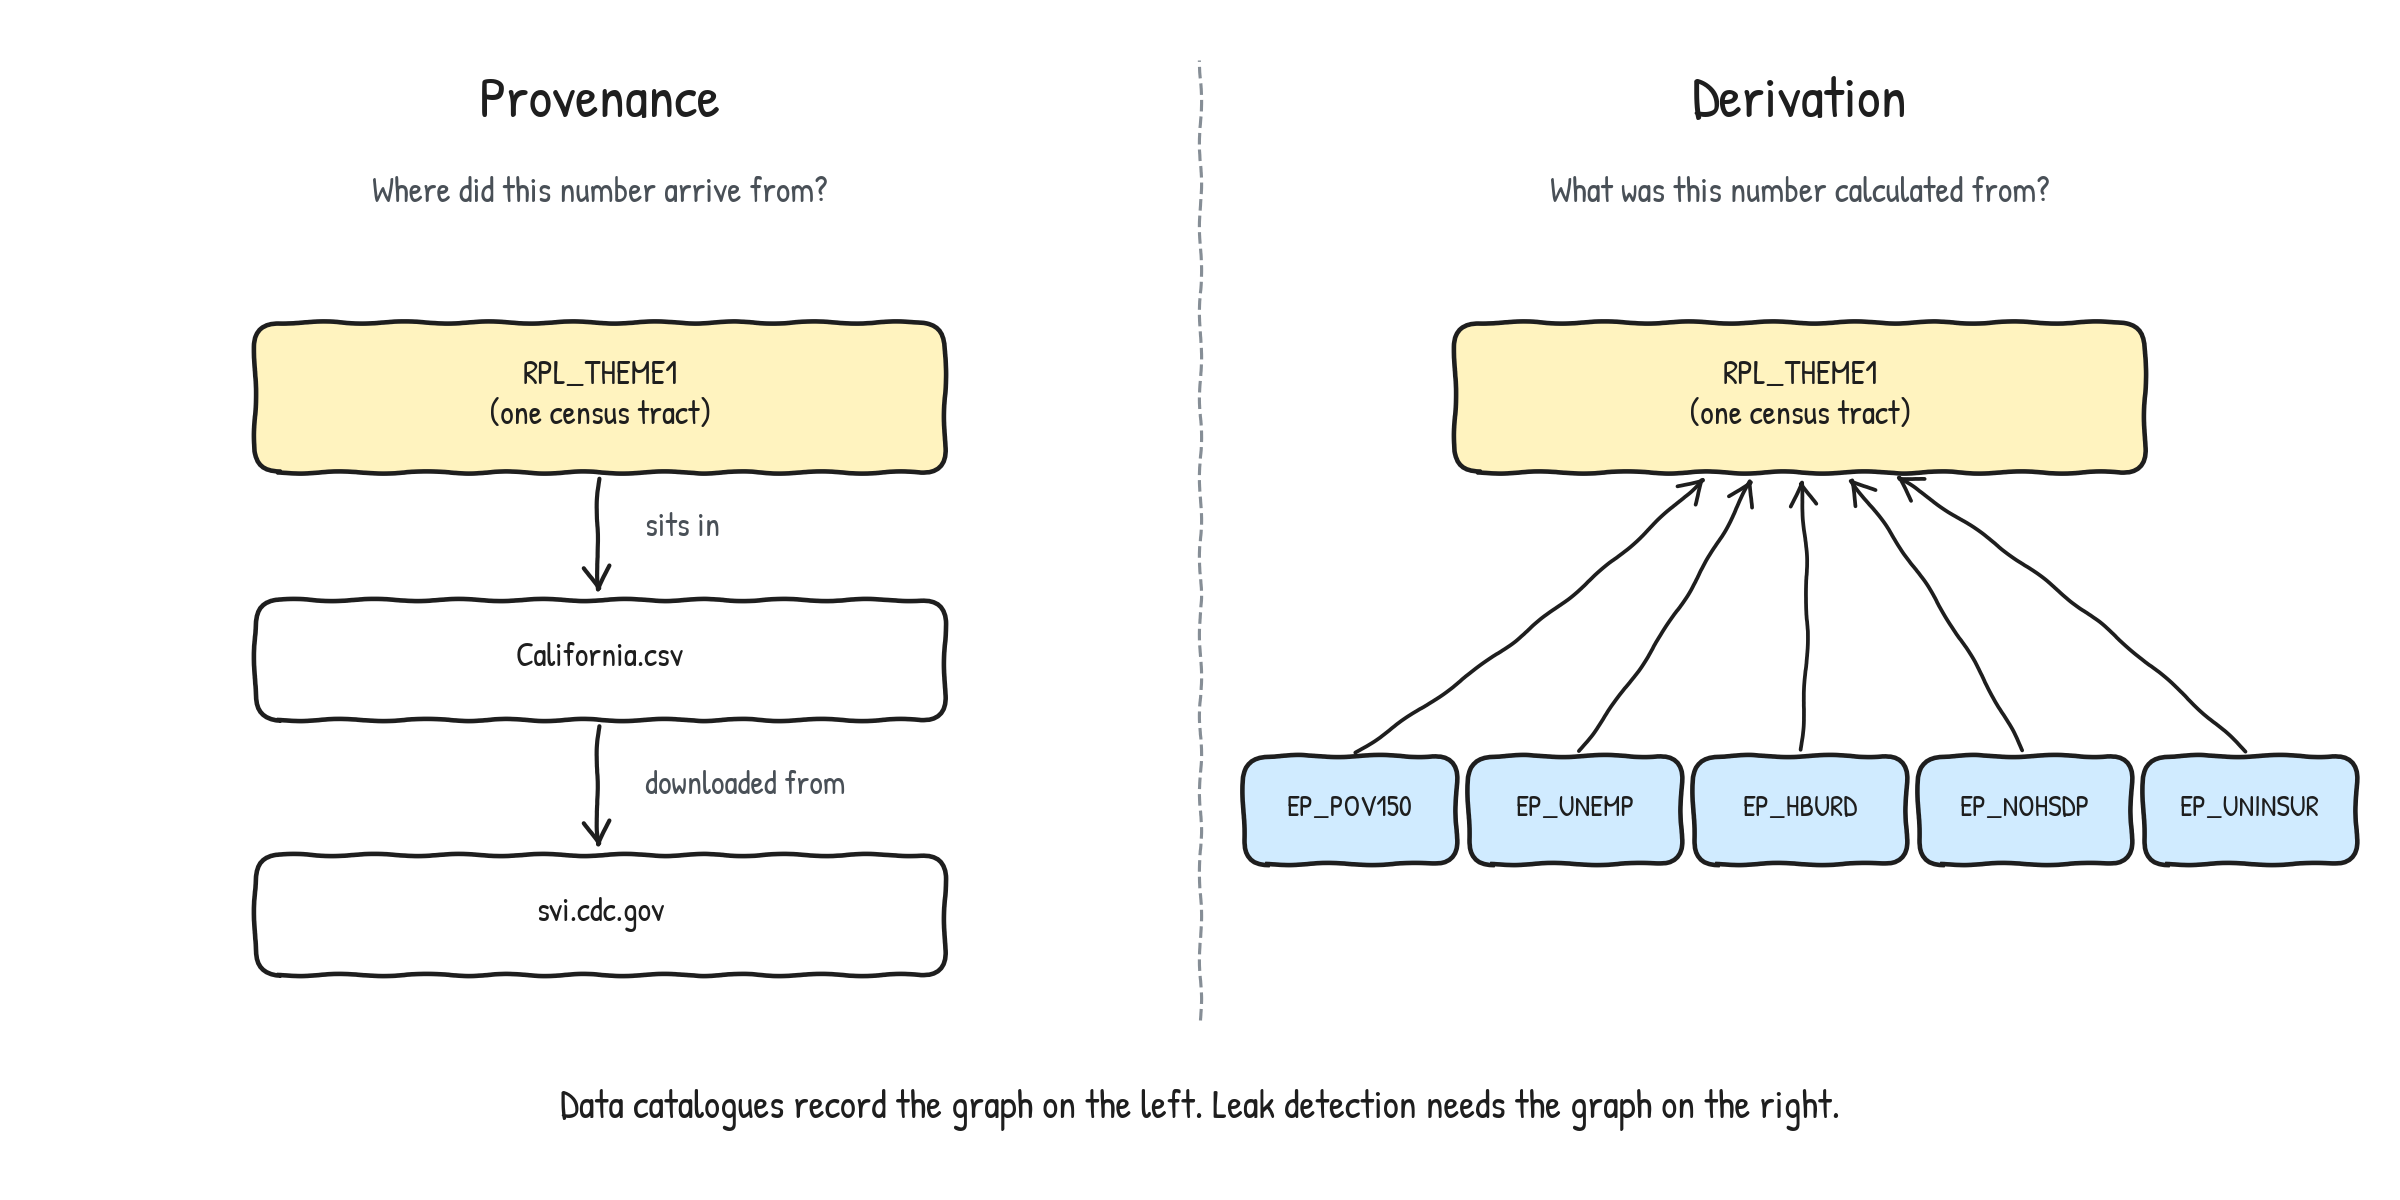
To understand why automated systems routinely miss these connections, data engineers distinguish between two distinct types of history that any numerical value can possess: data provenance and data derivation. Provenance records the physical file and web portal from which a data point arrived, such as a specific CSV downloaded from a federal server. Derivation, on the other hand, documents the specific ingredients and mathematical formulas used to calculate that value from underlying components.
While modern data catalogs excel at tracking physical provenance, derivation relationships typically remain trapped in human-readable PDF reports. When an automated machine learning pipeline searches a data warehouse for helpful covariates, it evaluates statistical correlations without regard to lineage, easily collecting variables that the target variable was originally built from.
Applying Dependency Management Principles to Data Science
Software engineering solved a structurally identical challenge decades ago through package managers. When a developer installs a software package, the package manager reads a manifest file detailing every dependency required by that package, as well as the sub-dependencies required by those dependencies. Because every relationship is explicitly recorded, the package manager can detect circular references, version conflicts, and architectural loops before installing any software.
Public data infrastructure requires a comparable system of explicit records. In a data dependency graph, every dataset or index functions as a node, while every derivation relationship functions as a directed edge pointing from an ingredient to the finished product. Because these pathways always move upward and away from raw inputs toward composite indices, the resulting structure forms a directed acyclic graph, meaning the arrows contain zero loops.
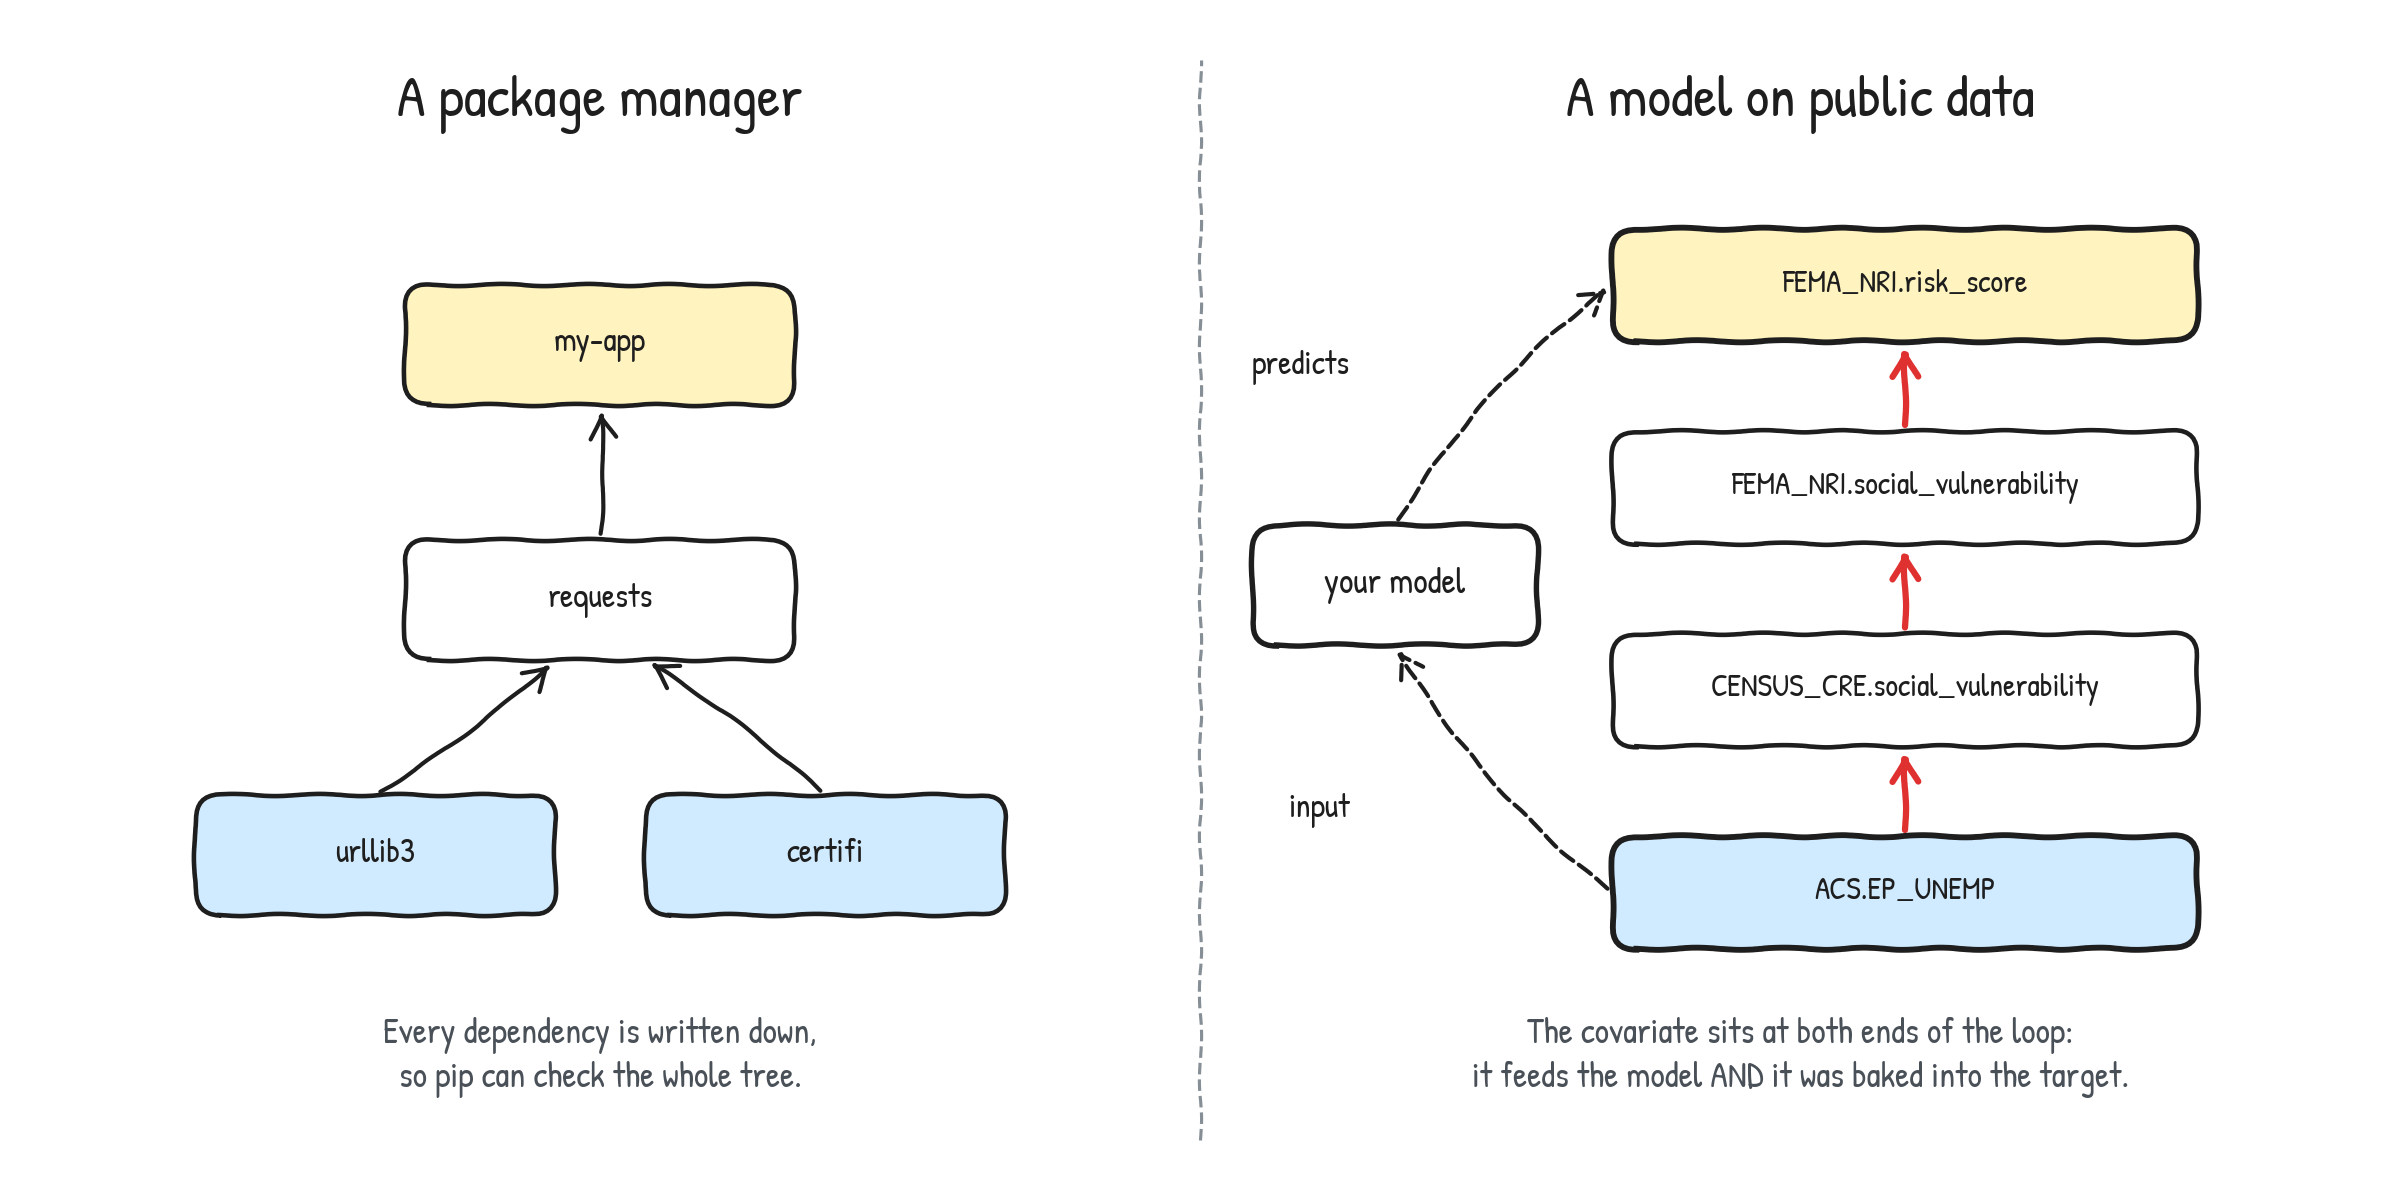
By defining every covariate’s position relative to the target variable within this graph, data scientists can enforce a strict validation rule: any proposed covariate that sits on a derivation path leading to or from the target variable must be automatically rejected to prevent target leakage.
Implementing this defense requires maintaining a dependency manifest, typically formatted in a structured language like YAML, that explicitly outlines every product and its known parents. Each relationship entry records not only the parent variable name but also the specific relation type—such as whether the parent acts as a mathematical component, an input to a statistical model, a direct identity republishing, a population weighting factor, or a fraction denominator. Furthermore, each edge incorporates a confidence rating ranging from certain and documented to inferred, allowing validation tools to weigh the strength of the evidence supporting the lineage claim.
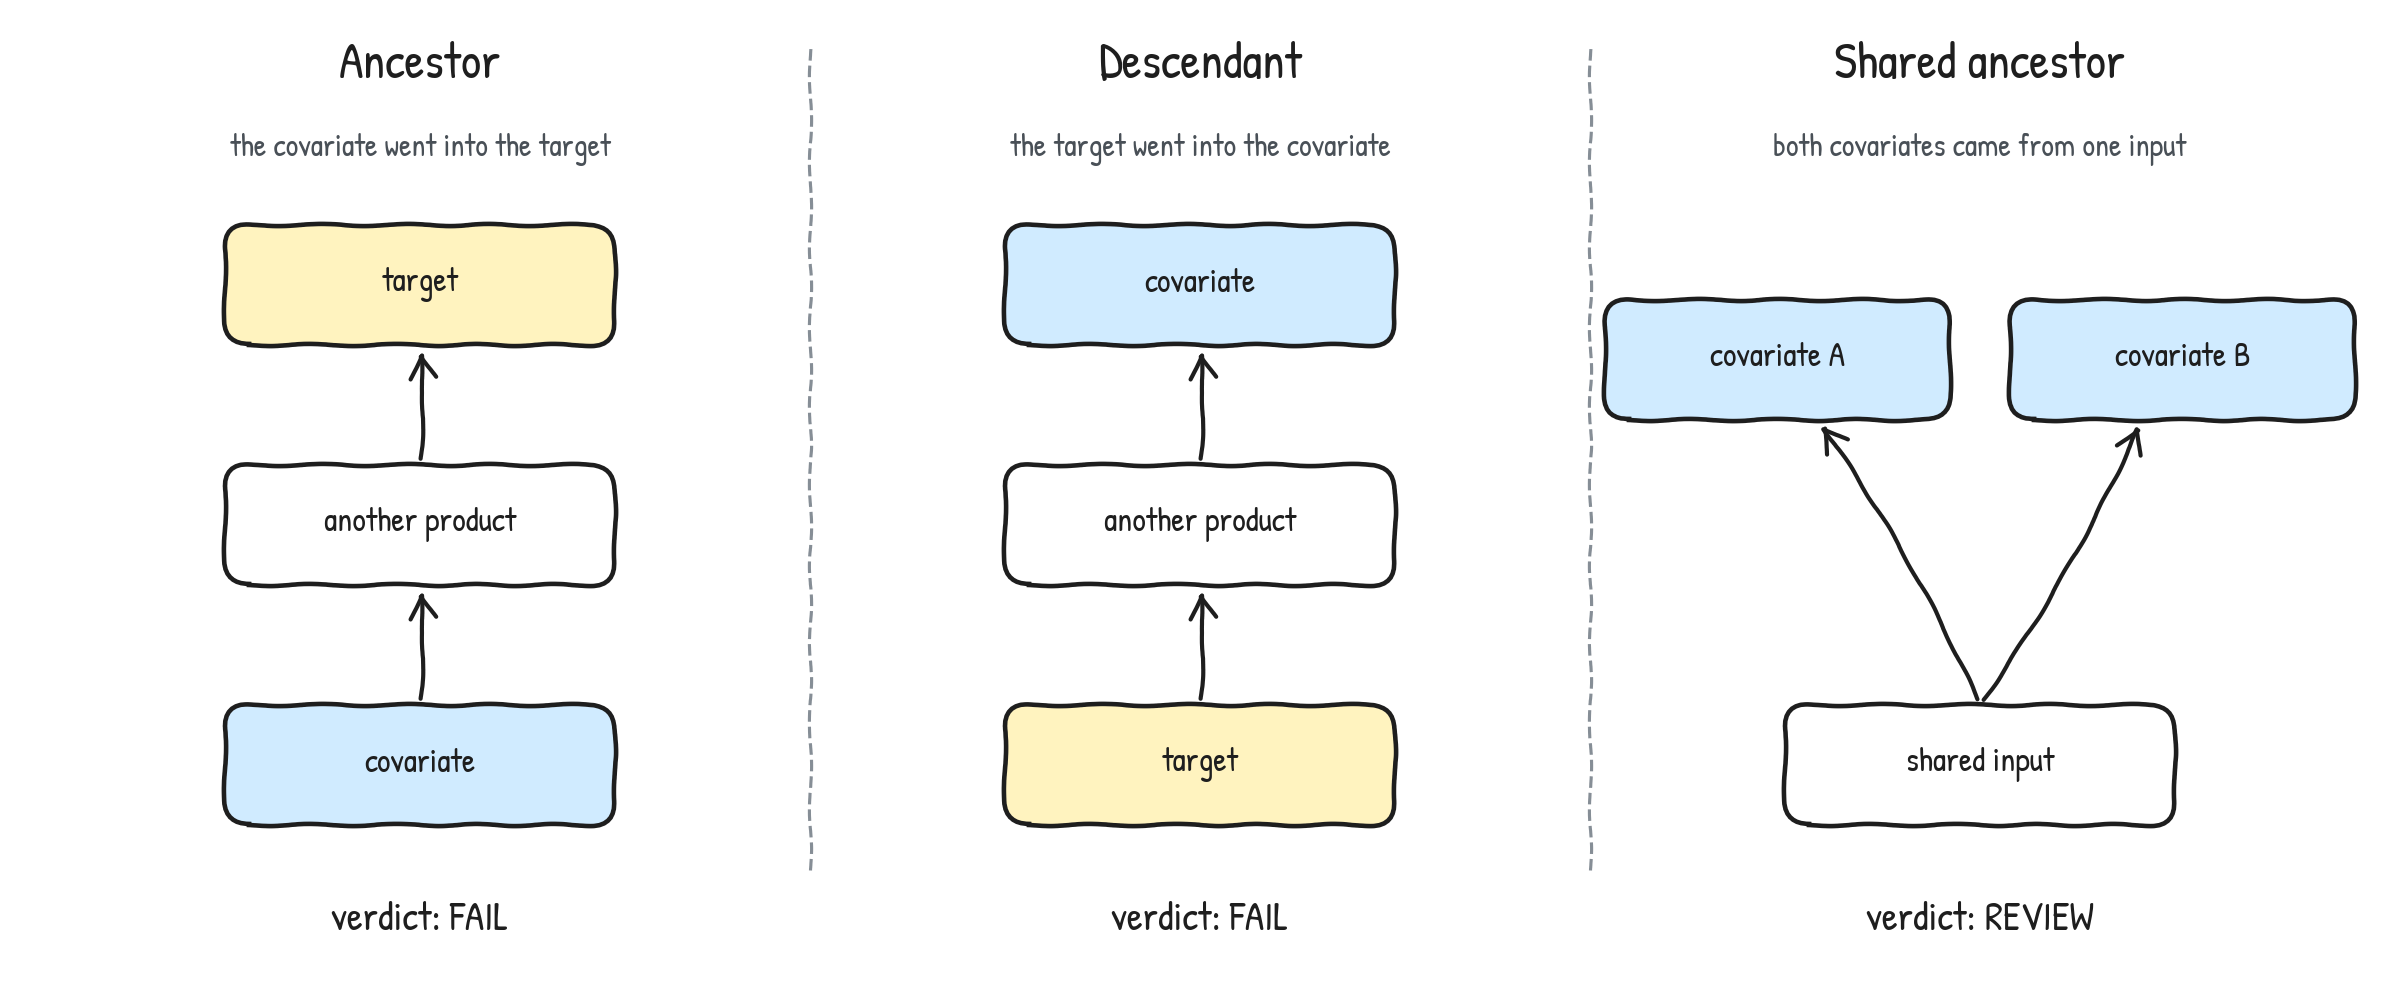
Building and Enforcing Lineage Checks
To operationalize these concepts, data teams can construct lightweight automated linters that inspect feature lists against a YAML manifest prior to model training. Much like code linters that scan source files for syntax errors before compilation, a lineage linter reads the dependency graph, traces the ancestors and descendants of a designated target variable, and evaluates every proposed covariate against those lineage paths.
When the linter evaluates a dataset, it performs comprehensive graph traversals using depth-first and breadth-first search algorithms to map out all possible routes between variables. If a proposed covariate appears within the target’s ancestry or descendancy, the tool flags the violation, categorizes the route as either deterministic arithmetic or statistical modeling, and identifies the weakest confidence link along the path.
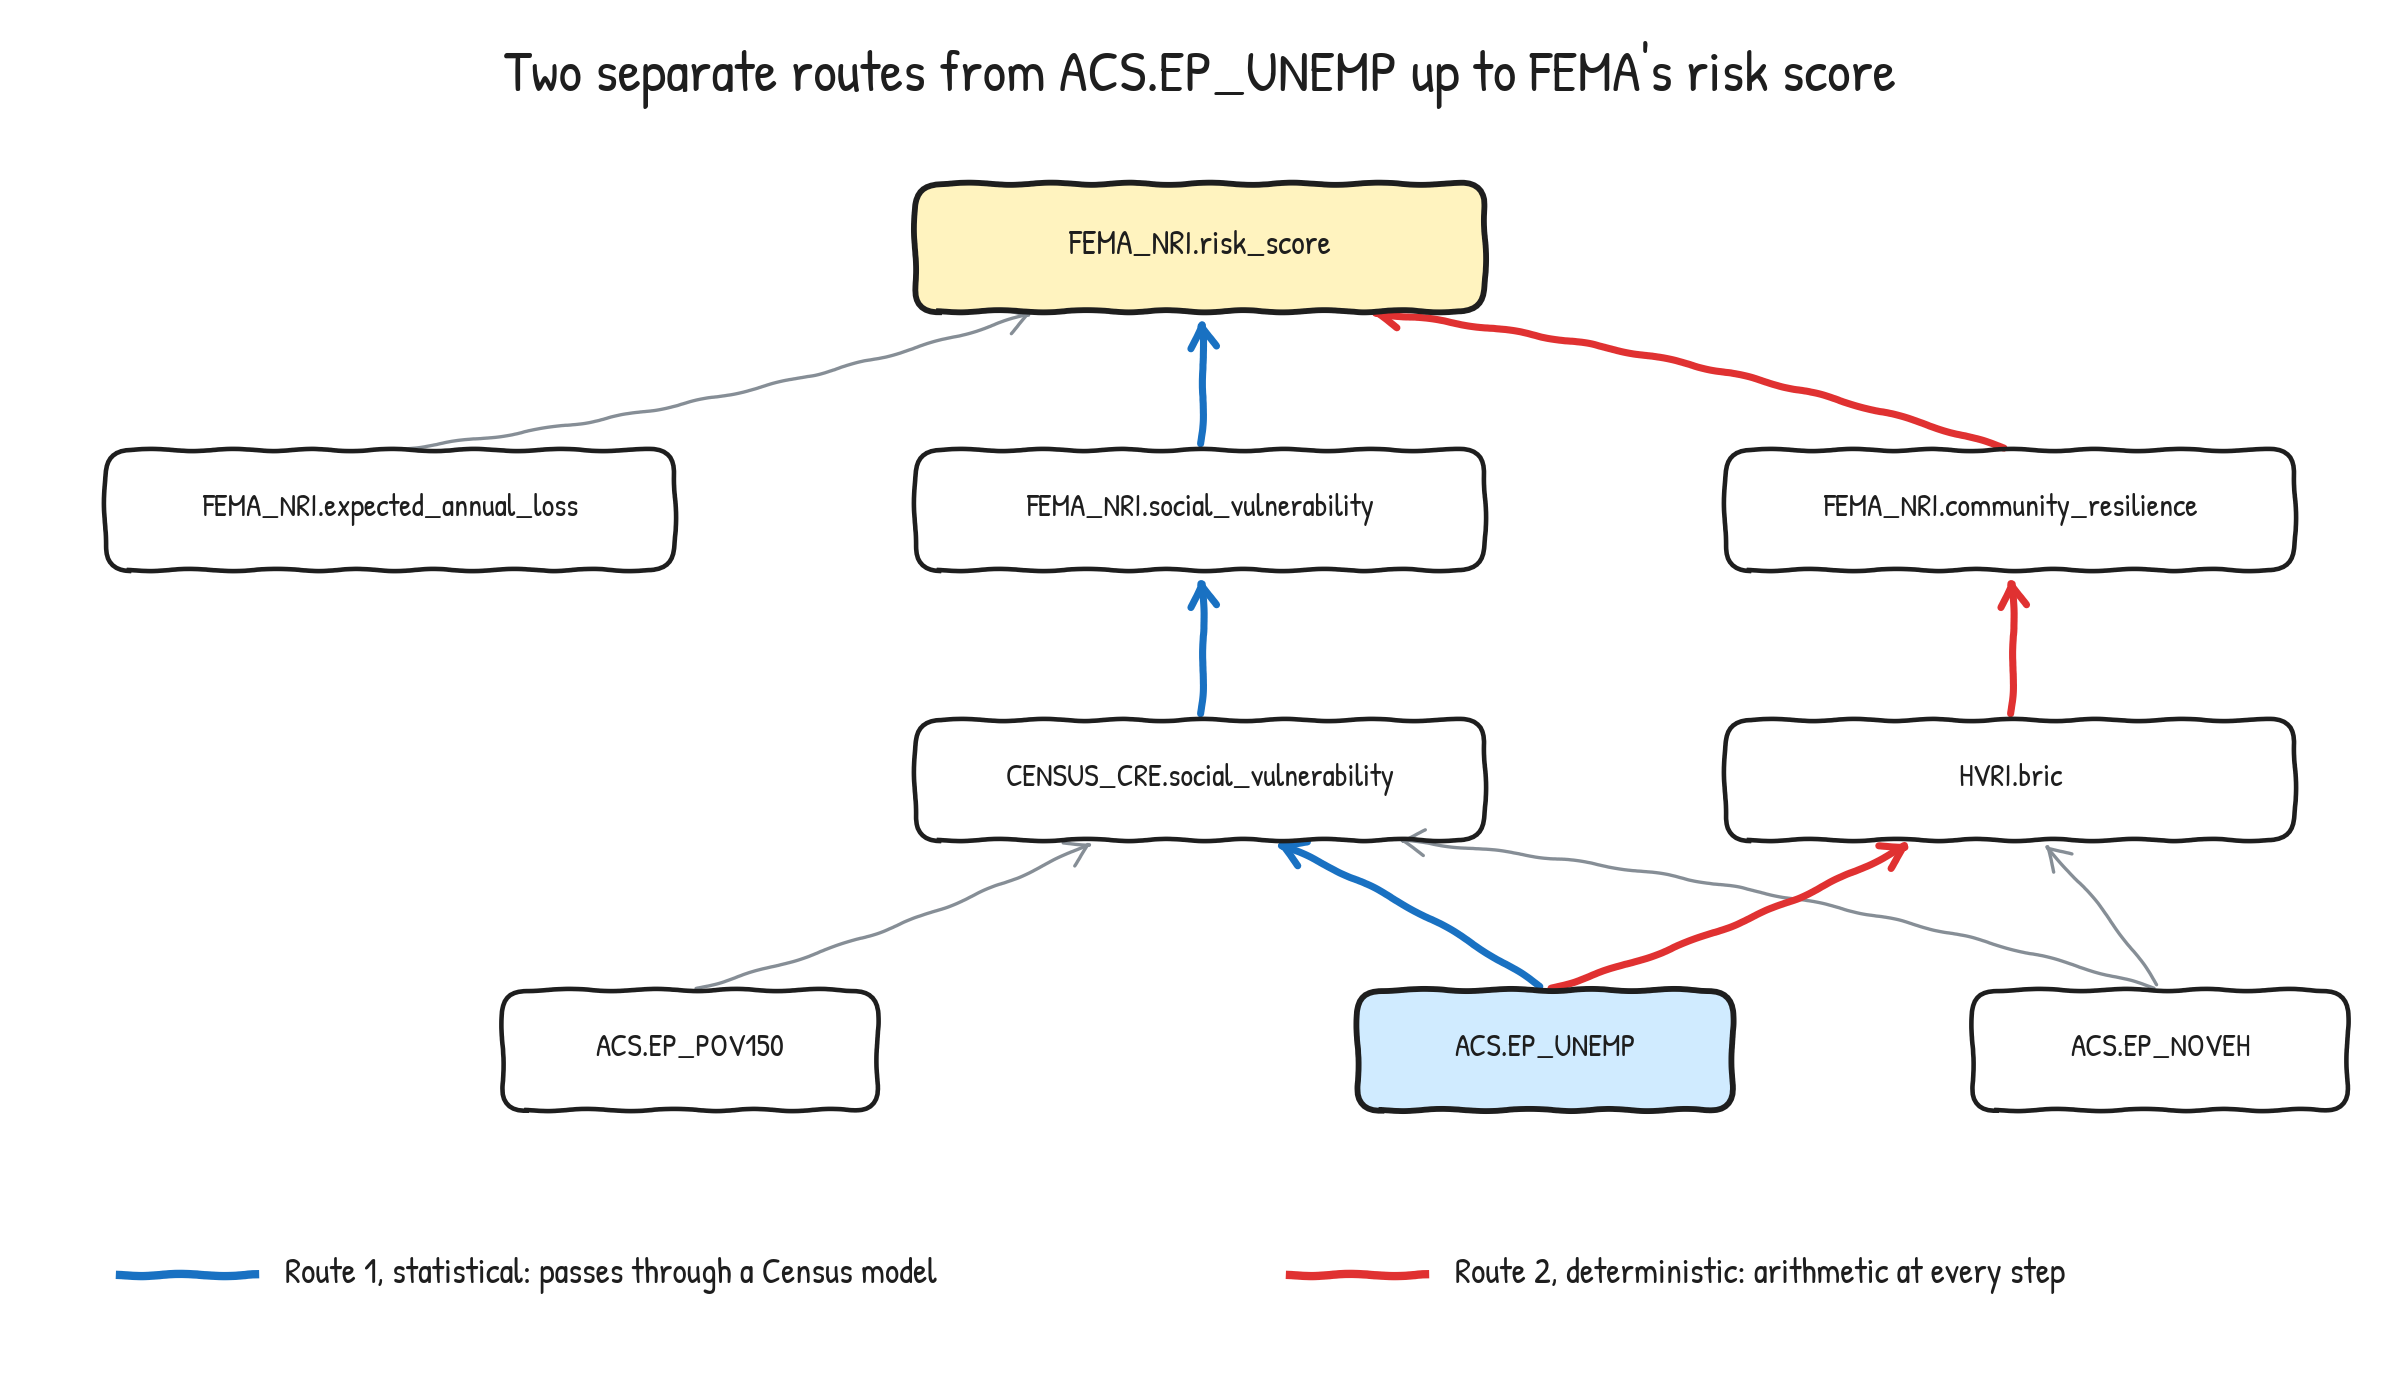
Automating this check within continuous integration pipelines ensures that model training scripts cannot execute if leaky features are introduced into the feature set. By establishing rigorous exit codes—distinguishing between successful validation passes, detected leaks, and malformed manifest files—engineering teams can maintain strict quality controls across their machine learning workflows.
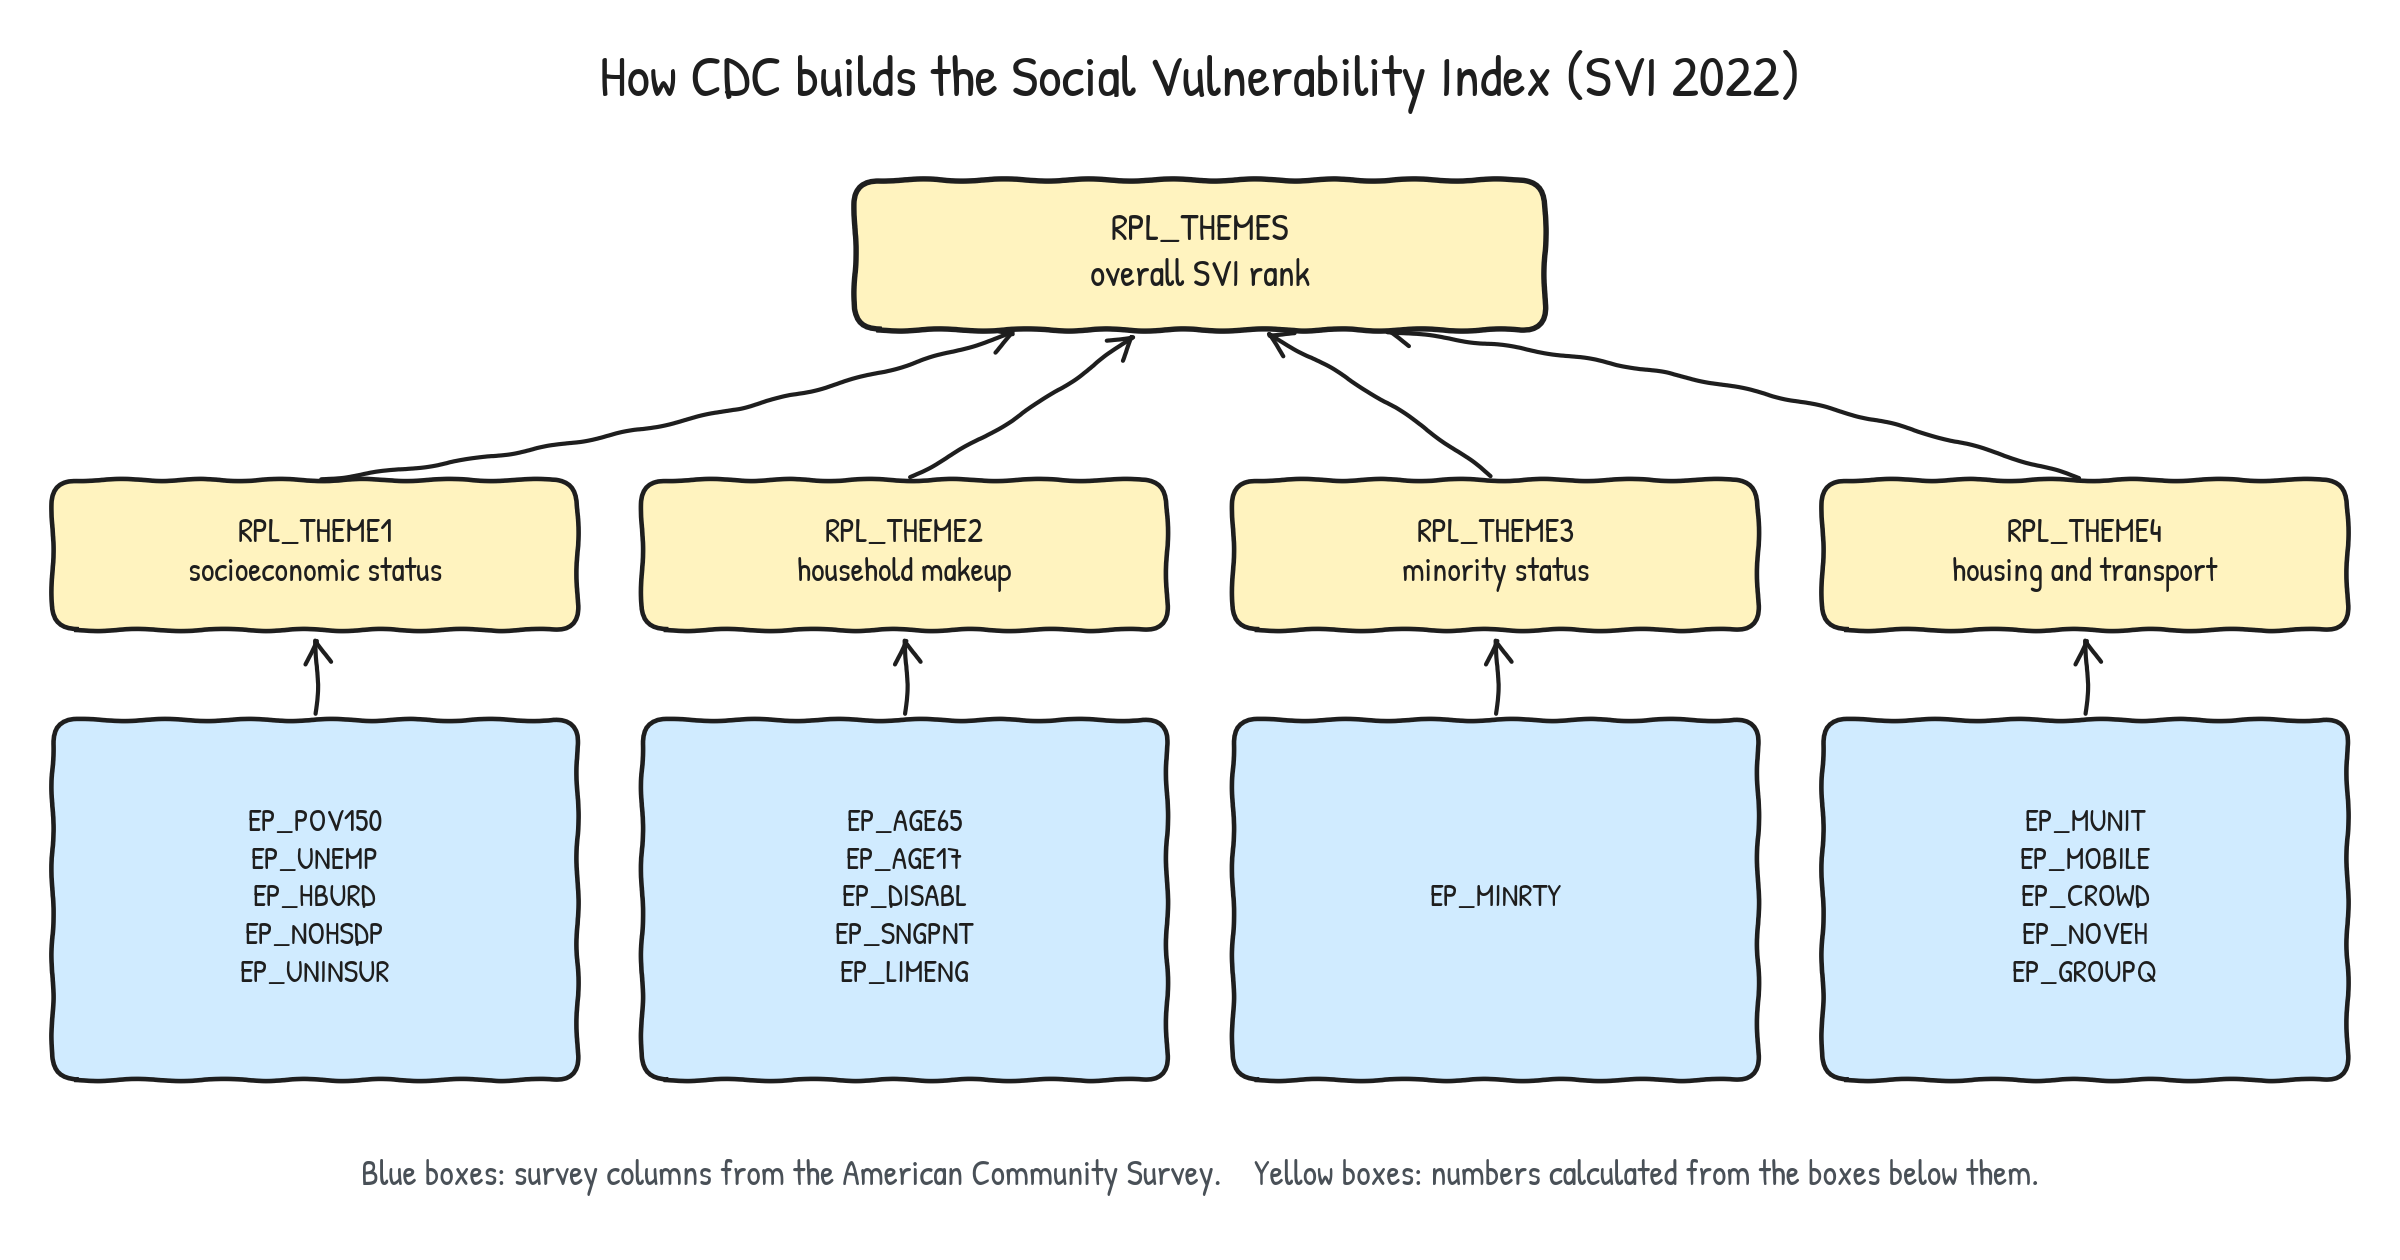
Experience with building these graph-based linters reveals that data integrity checks require meticulous attention to detail. Initial assumptions about which variables constitute independent bystanders versus hidden components can easily invalidate an audit. For instance, detailed analyses of CDC social vulnerability datasets demonstrate that unranked demographic columns, when aggregated, can sum precisely to intermediate theme scores that feed directly into overall indices. Without a rigorously maintained dependency manifest verified against official methodology documents, automated systems can easily misclassify derived components as safe, independent covariates.
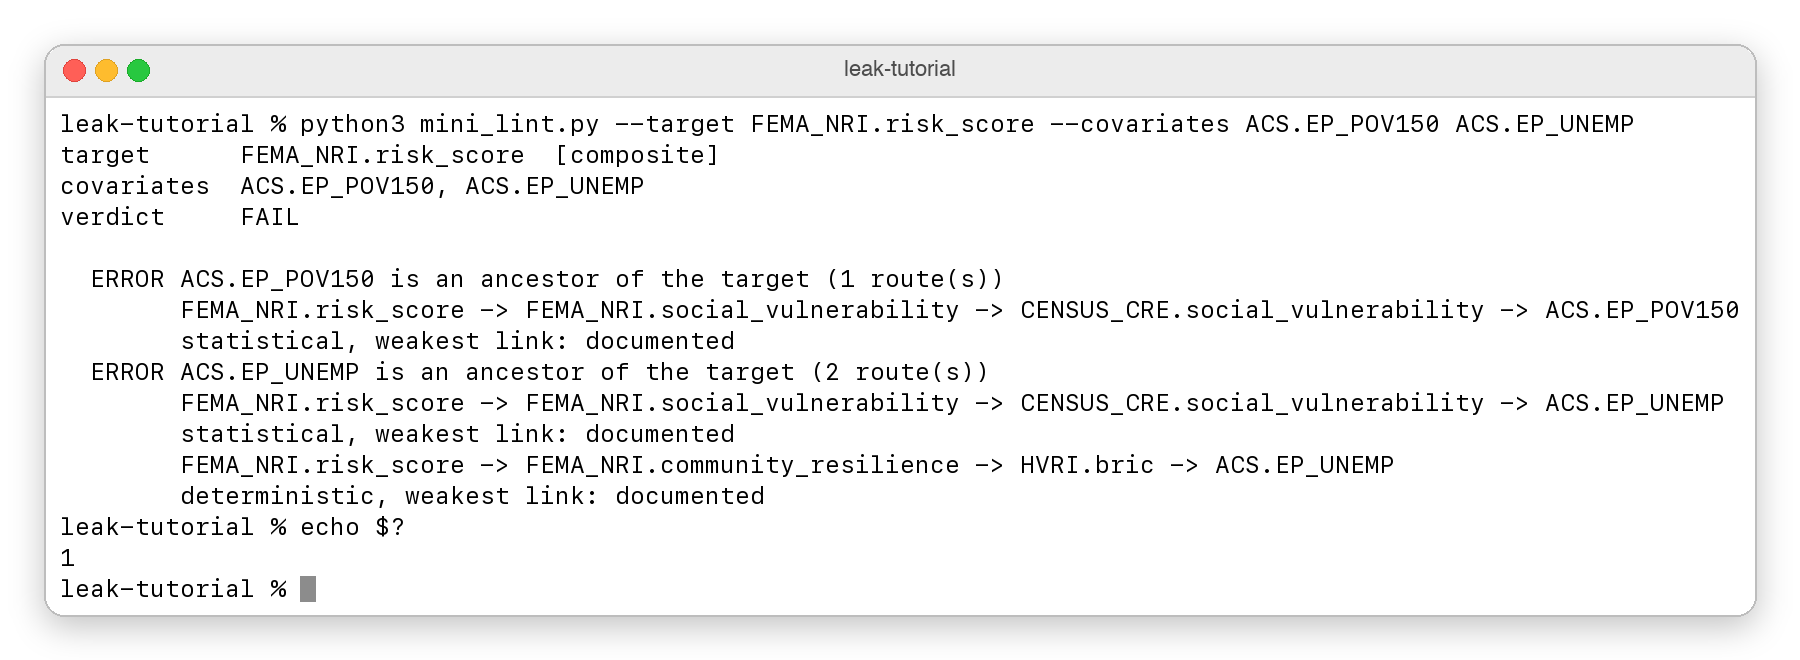
As machine learning models increasingly drive public policy, emergency planning, and resource allocation, safeguarding training pipelines against subtle forms of data contamination becomes paramount. By treating data lineage with the same rigorous dependency management principles traditionally reserved for software source code, data scientists can ensure that high model performance reflects genuine real-world predictive power rather than the unintended rediscovery of pre-existing government formulas.