












When a machine learning model outputs a prediction score of 0.9, data scientists and engineers naturally interpret it as a 90% chance of a specific outcome. Decision thresholds are set, business logic is applied, and automated actions are triggered on the assumption that the model’s internal confidence matches reality. However, a deeper inspection of cases scored near 0.9 frequently reveals a troubling discrepancy: noticeably fewer of those predictions are correct than the score implies.
The underlying model is not necessarily broken. It may rank cases remarkably well, effectively separating positive instances from negative ones, yet remain a poor judge of its own certainty. This gap between a raw predictive score and a true probability is precisely what model calibration is designed to close. Recent updates in machine learning frameworks, including major architectural shifts in Scikit-Learn version 1.6, have refined how practitioners address miscalibration, providing robust tools to align model confidence with empirical accuracy.
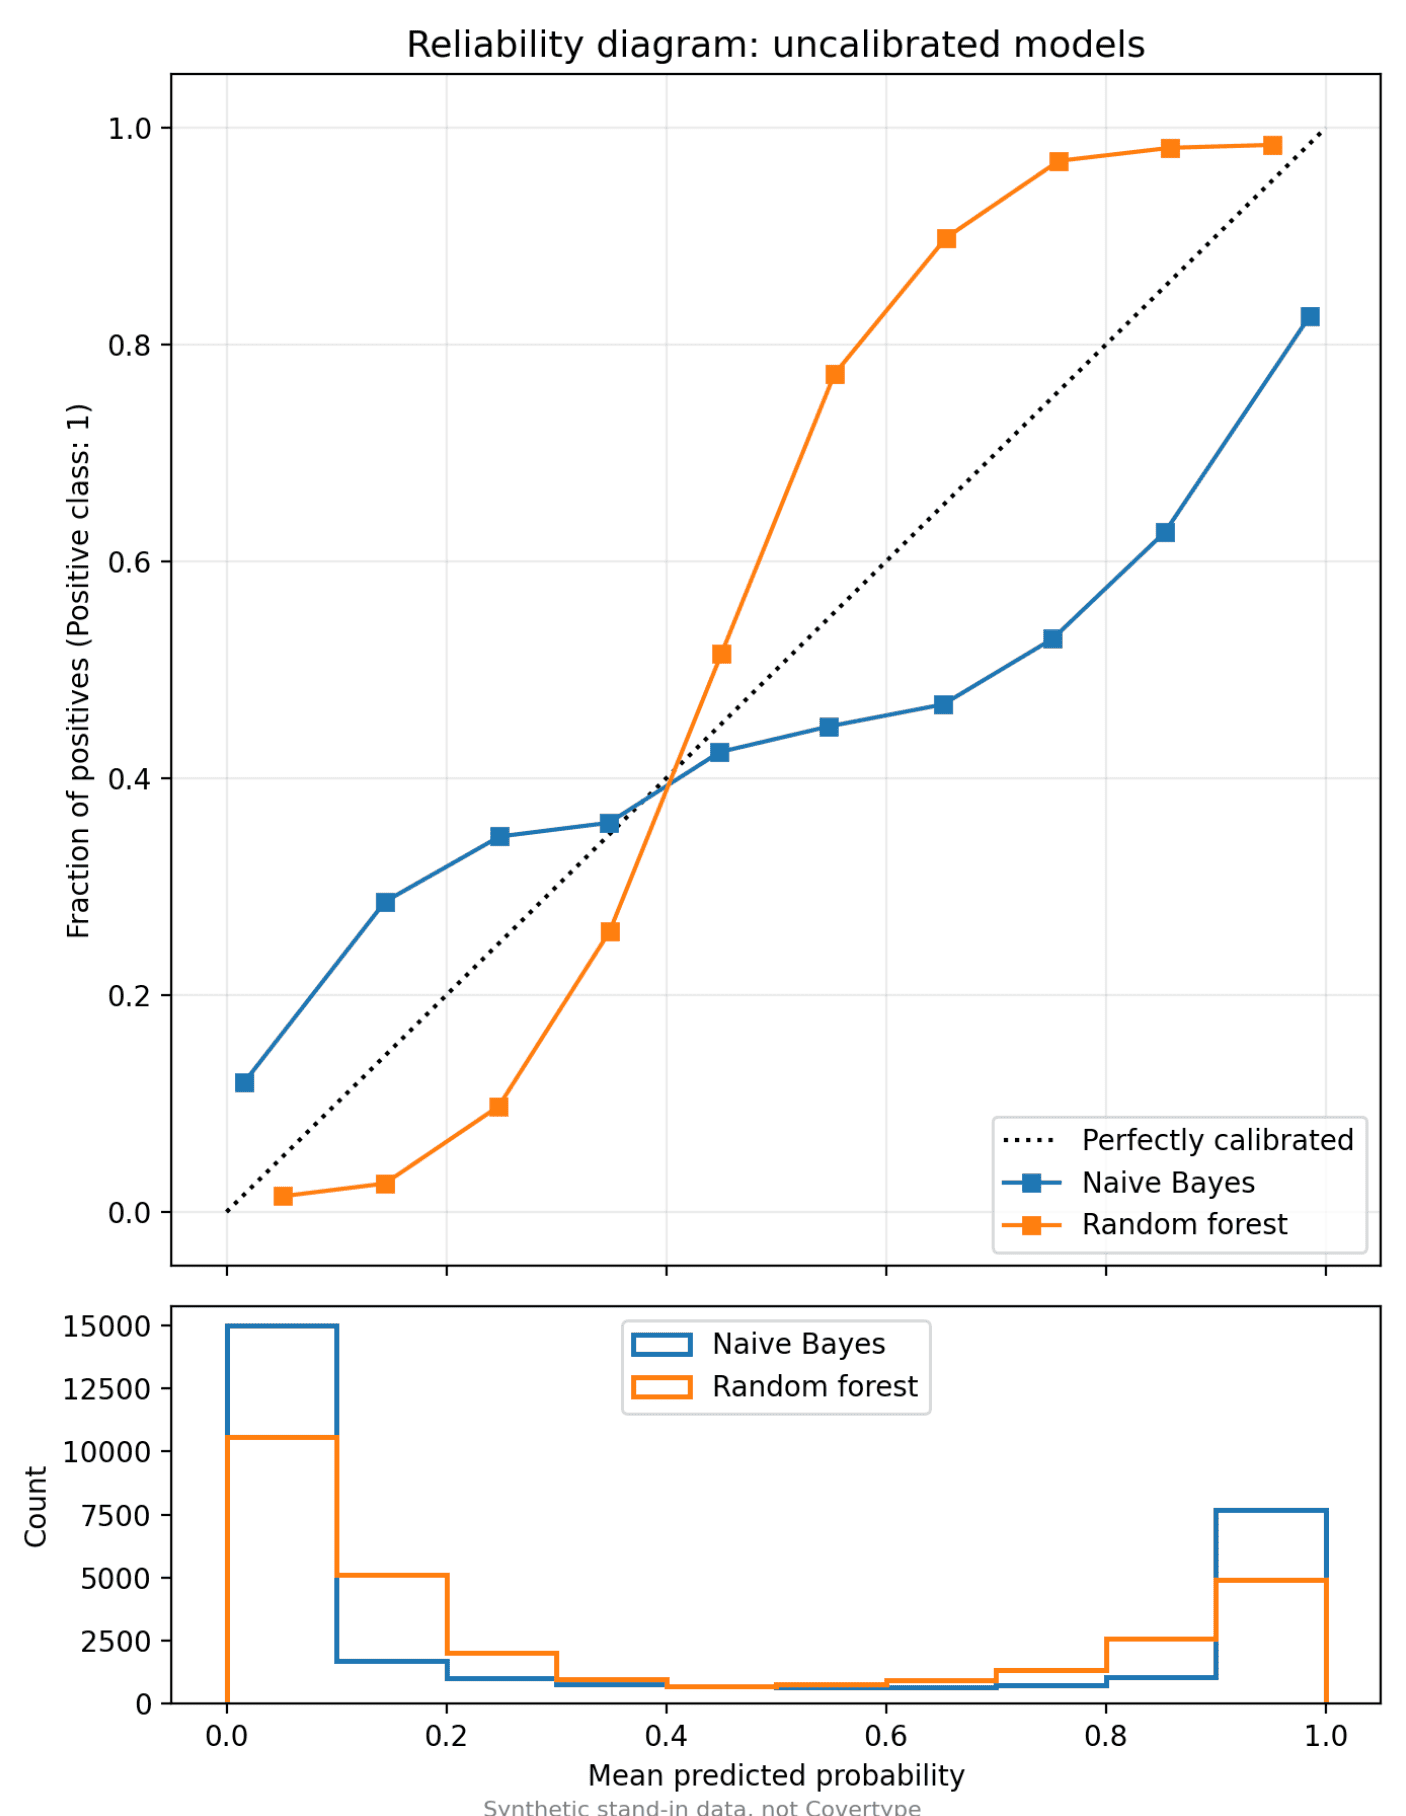
To understand the mechanics of calibration, developers often turn to benchmark environments using real-world tabular data, such as the extensive Covertype dataset featuring hundreds of thousands of forest patches with dozens of descriptive features. By transforming multiclass classification problems into binary scenarios—such as predicting a dominant tree species against all other possibilities—engineers can expose the inherent miscalibration of popular algorithms like Gaussian Naive Bayes and Random Forests.

Different classification algorithms exhibit distinct, predictable tendencies regarding probability outputs. Logistic regression, by its mathematical formulation, tends to be inherently well-calibrated. In contrast, Gaussian Naive Bayes aggressively pushes predicted probabilities toward the extreme ends of zero and one, creating an overconfident distribution. Random forests typically avoid these extreme boundaries, pulling probabilities toward the center, while maximum-margin methods like support vector machines produce a distinct S-shaped distortion.

Detecting these flaws requires more than standard metrics like accuracy or the area under the receiver operating characteristic curve, commonly known as ROC-AUC. Both metrics evaluate label assignments or ranking orders rather than verifying whether a score of 0.8 actually translates to an 80 occurrence rate. Consequently, a model can achieve exceptional scores on both fronts while remaining wildly overconfident or underconfident in its individual outputs.
Addressing miscalibration effectively requires a meticulous data management strategy. Calibrating a classifier on the same data used to train it introduces severe bias, because models are inherently overconfident on their own training samples. To circumvent this, machine learning pipelines must incorporate a strict three-way data split, separating data into training, calibration, and independent test sets. The calibrator must learn exclusively from data untouched by the primary training phase to ensure that the resulting probabilities reflect true generalization.
In Scikit-Learn, modern implementations streamline this process through specialized components. Recent library updates introduced features like the FrozenEstimator, replacing older cross-validation parameters and ensuring seamless integration with calibration wrappers. When diagnosing a model, reliability diagrams—also known as calibration curves—serve as visual diagnostic tools. By grouping predictions into discrete probability bins and plotting the average prediction against the actual share of positive outcomes in each bin, engineers can instantly visualize whether a model is overconfident or underconfident.
Once miscalibration is diagnosed, developers can choose between two primary mathematical corrections: Platt scaling or isotonic regression. Platt scaling fits a parametric logistic curve over the model’s raw outputs. Relying on just two parameters learned through maximum likelihood estimation, it is remarkably resistant to overfitting and serves as the preferred choice when working with smaller calibration datasets. Furthermore, because it is strictly monotonic, Platt scaling preserves the exact ranking of predictions, ensuring that ROC-AUC metrics remain entirely unaffected.
Isotonic regression offers a non-parametric alternative, fitting a flexible step-wise function that never decreases as the underlying score increases. This adaptability allows it to correct complex, arbitrary distortions that go beyond simple S-curves. However, this flexibility comes with trade-offs. Isotonic regression requires substantially more data to avoid overfitting—typically demanding several thousand calibration samples—and can introduce prediction ties that slightly alter the ROC-AUC score.
Choosing the right calibration technique depends heavily on the available data volume and specific operational constraints. When working with fewer than a thousand calibration samples, Platt scaling remains the safest and most reliable option. For larger datasets comprising tens of thousands of samples, isotonic regression can deliver superior calibration, provided its performance is validated against sigmoid scaling. For multiclass challenges, recent framework expansions continue to introduce advanced parameter-efficient techniques, such as temperature scaling, which apply unified adjustments across multiple classes simultaneously.
For development environments lacking spare data for an independent calibration set, built-in cross-validation wrappers within calibration classes offer a viable alternative. These utilities automatically partition training data across multiple folds, training base models on subsets while fitting calibrators on the held-out portions, and ultimately averaging the resulting probabilities to prevent data leakage.
Ultimately, bridging the gap between raw model scores and true statistical probabilities is an essential step in deploying reliable machine learning systems. By combining rigorous data splitting, visual reliability diagnostics, and appropriate mathematical scaling methods, engineers can ensure that their models not only rank outcomes correctly, but also communicate their true level of certainty to downstream applications.