












Understanding the foundational mechanics of a neural network often begins with a familiar mathematical concept: the straight-line equation. As explored in previous discussions utilizing the linear formula $y = ax + b$, a straight line provides an intuitive entry point into how models map inputs to outputs. However, a critical question arises when examining real-world information: what happens when the relationship between an input and an output is inherently non-linear?
In practical applications, data rarely follows a strictly linear pattern. Real-world phenomena frequently exhibit changing behaviors, thresholds, and saturation points that cannot be described by a single, unchanging rule. This realization introduces the concept of non-linearity, a vital component that empowers neural networks to capture complex, multi-faceted relationships within data. By examining the transition from linear assumptions to piecewise curves, Rectified Linear Unit (ReLU) functions, and sigmoid curves, observers can better understand how modern architectures process information that defies simple straight-line descriptions.
When a Straight Line Is Enough
A straight-line equation relies on the premise that the same proportional rule applies uniformly across an entire relationship. Represented as $y = ax + b$, the formula consists of an output variable $y$, an input variable $x$, a slope $a$ indicating how much $y$ changes relative to $x$, and a y-intercept $b$ representing the baseline value of $y$ when $x$ is zero.

Consider a practical scenario involving a mathematics educator named Ms. Poly, who aims to develop a study plan to help her students excel on their final examinations. Seeking a straightforward rule of thumb, she assumes that a student’s final score is directly proportional to the number of hours they spend studying per week. Under this assumption, $y$ represents the marks scored, $x$ denotes the weekly study hours, $a$ signifies the expected score increase per hour studied, and $b$ accounts for a baseline score a student might achieve without formal preparation.
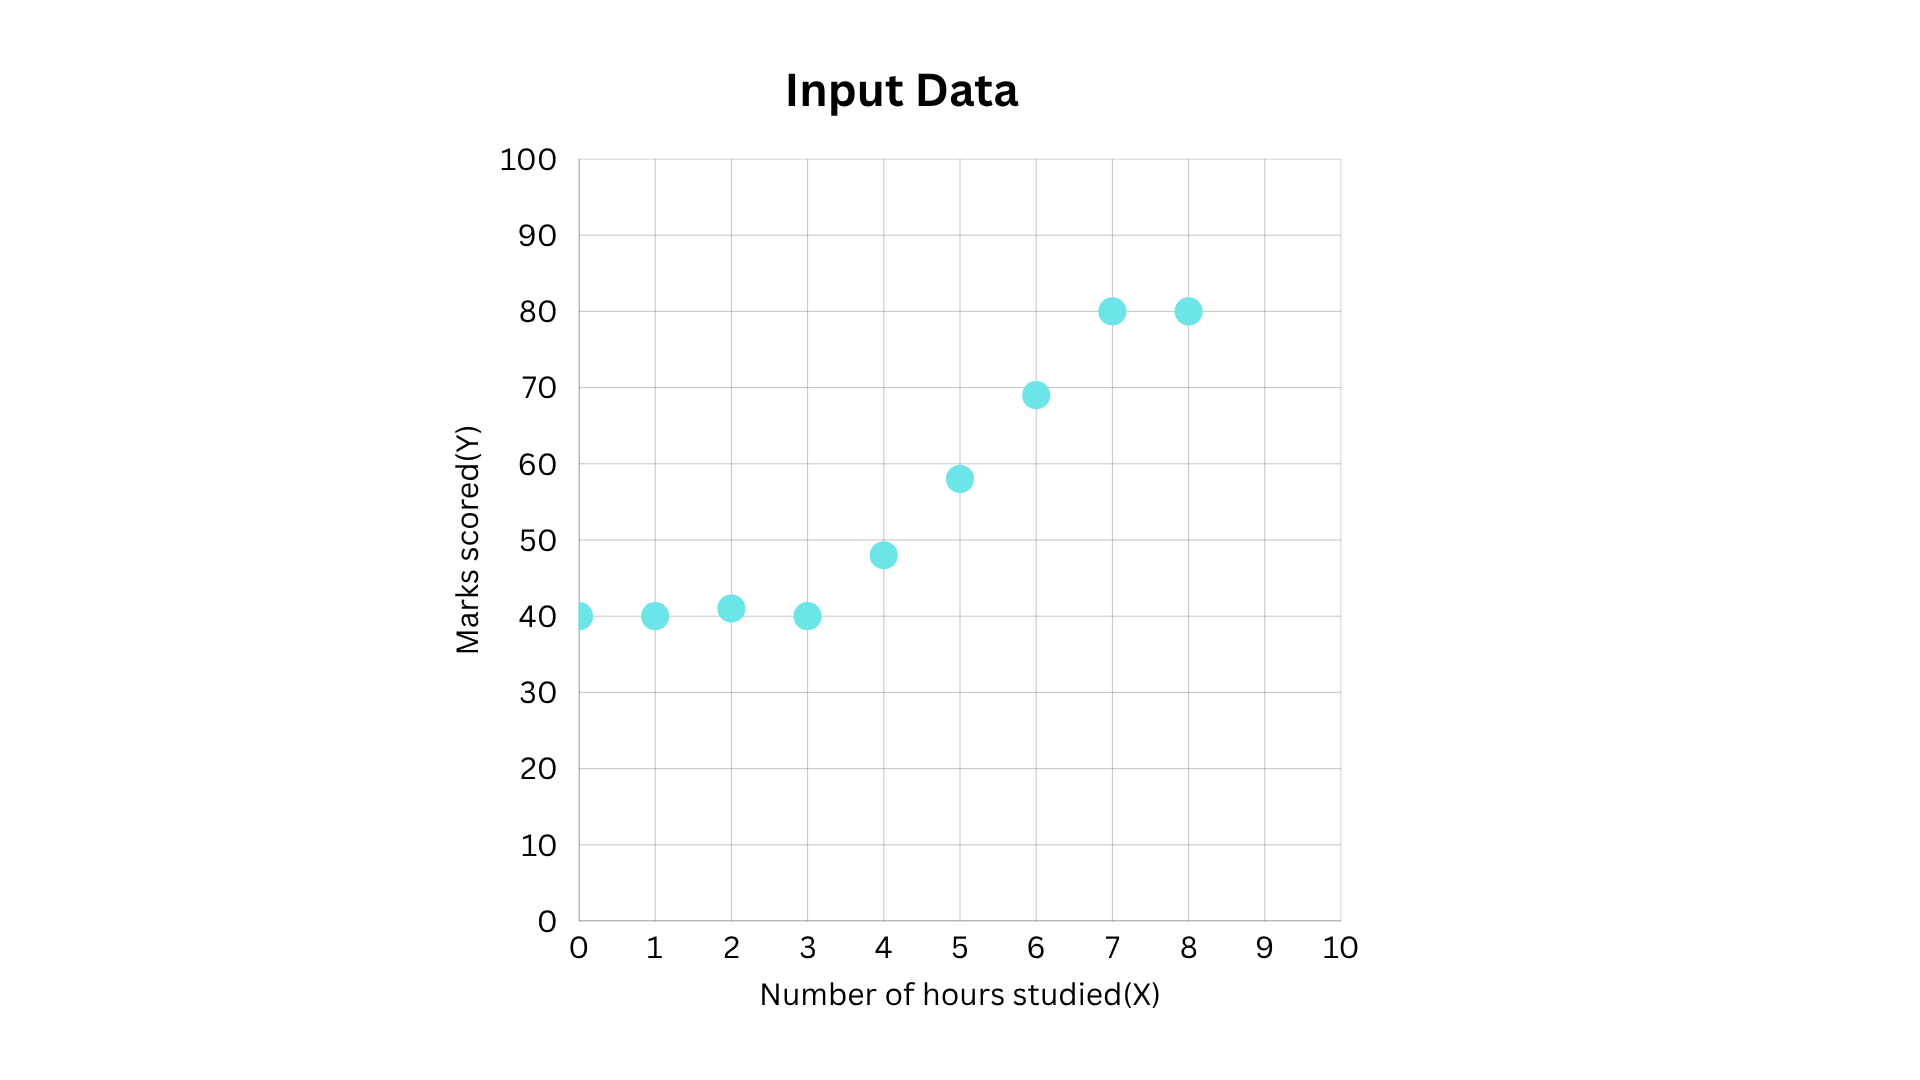
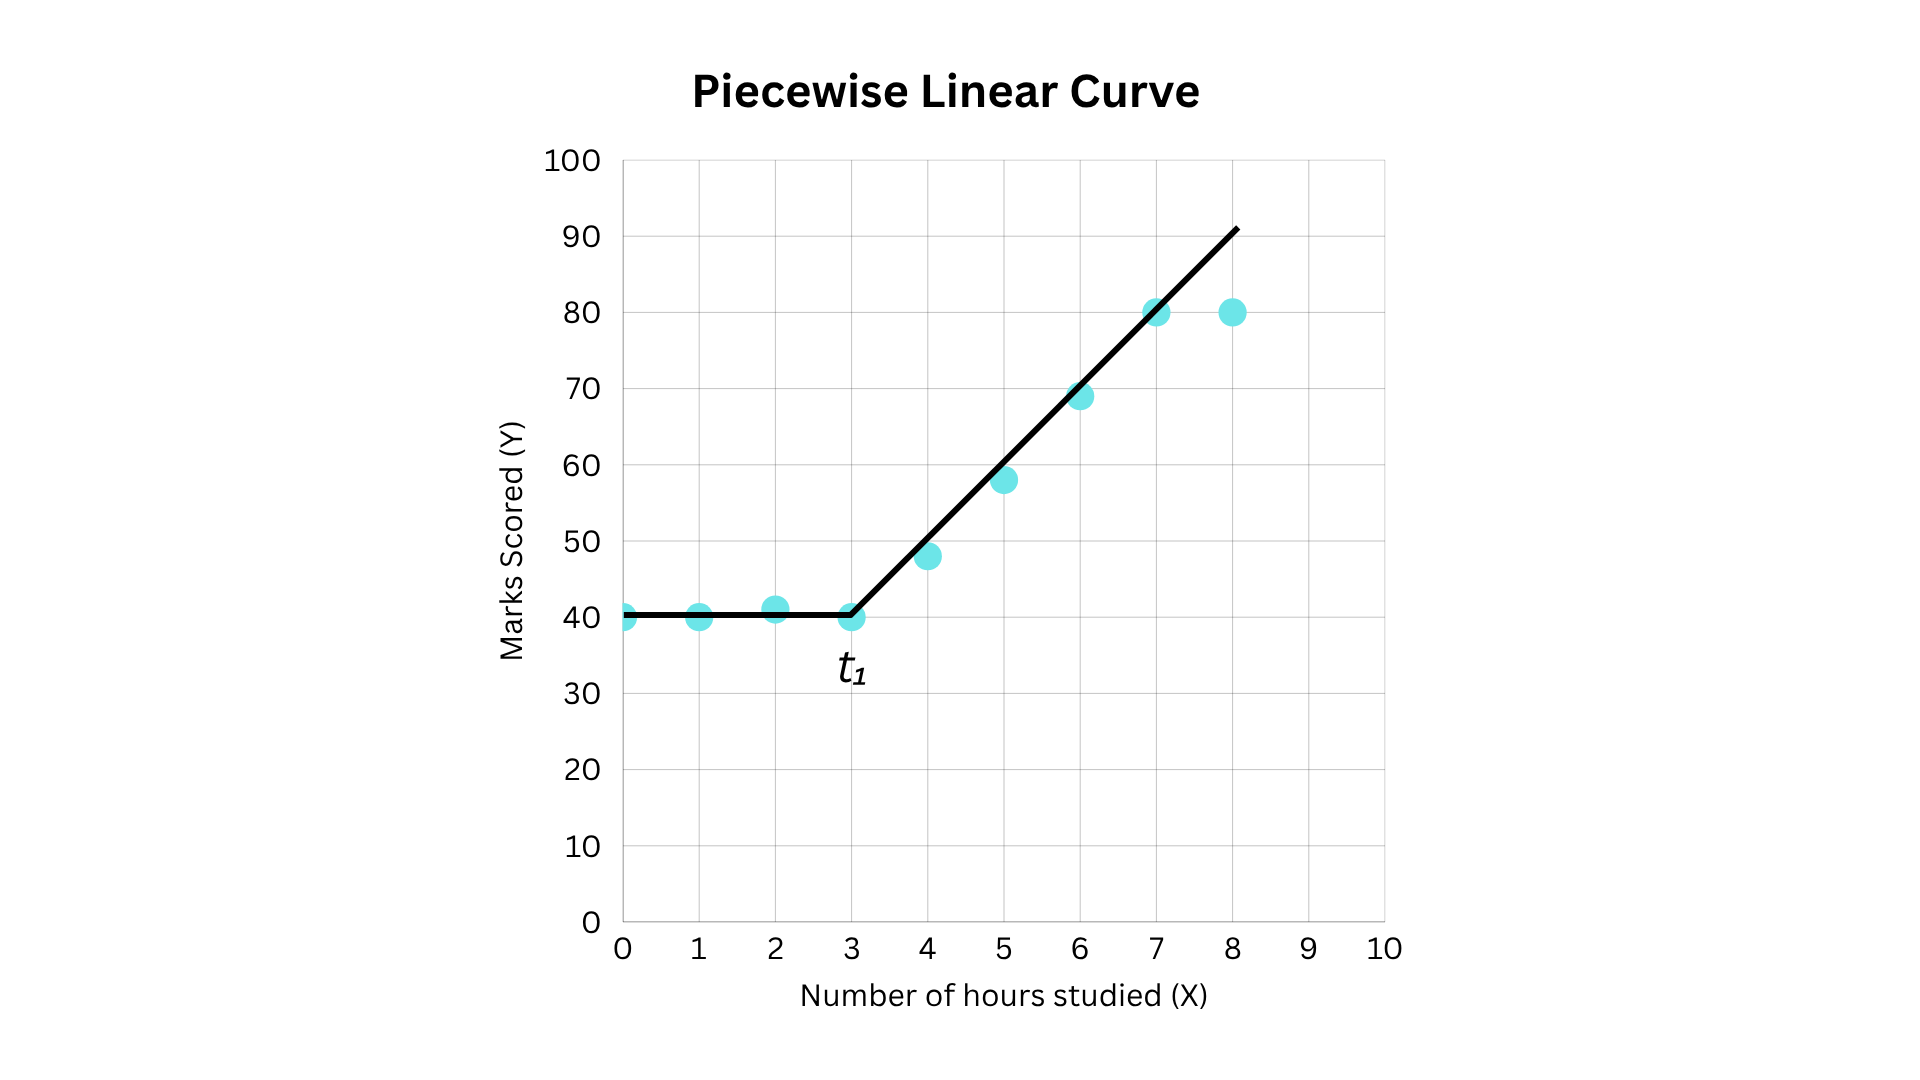
Following a quarterly examination, Ms. Poly surveys her students to gather empirical data on weekly study hours and corresponding test scores. When she plots this information, she finds a collection of data points showing students with zero to one hour of study scoring around 40 marks, while students studying two to three hours remain near that same baseline. Higher study commitments, such as four, five, six, and seven hours, show progressive score increases reaching up to 80 marks, after which additional hours yield no further score gains. When Ms. Poly attempts to apply her simple linear formula to this dataset, the predictions fail to align with the observed outcomes, illustrating that real-life relationships are rarely straightforward.
When a Straight Line Isn’t Enough
A closer inspection of the plotted data reveals distinct behavioral phases. Students who invest only a minimal amount of time see negligible improvements in their scores. Once preparation crosses a specific threshold, however, performance begins to climb steadily with each additional hour of study. Beyond a subsequent threshold, the score gains plateau, and performance remains constant regardless of further studying.
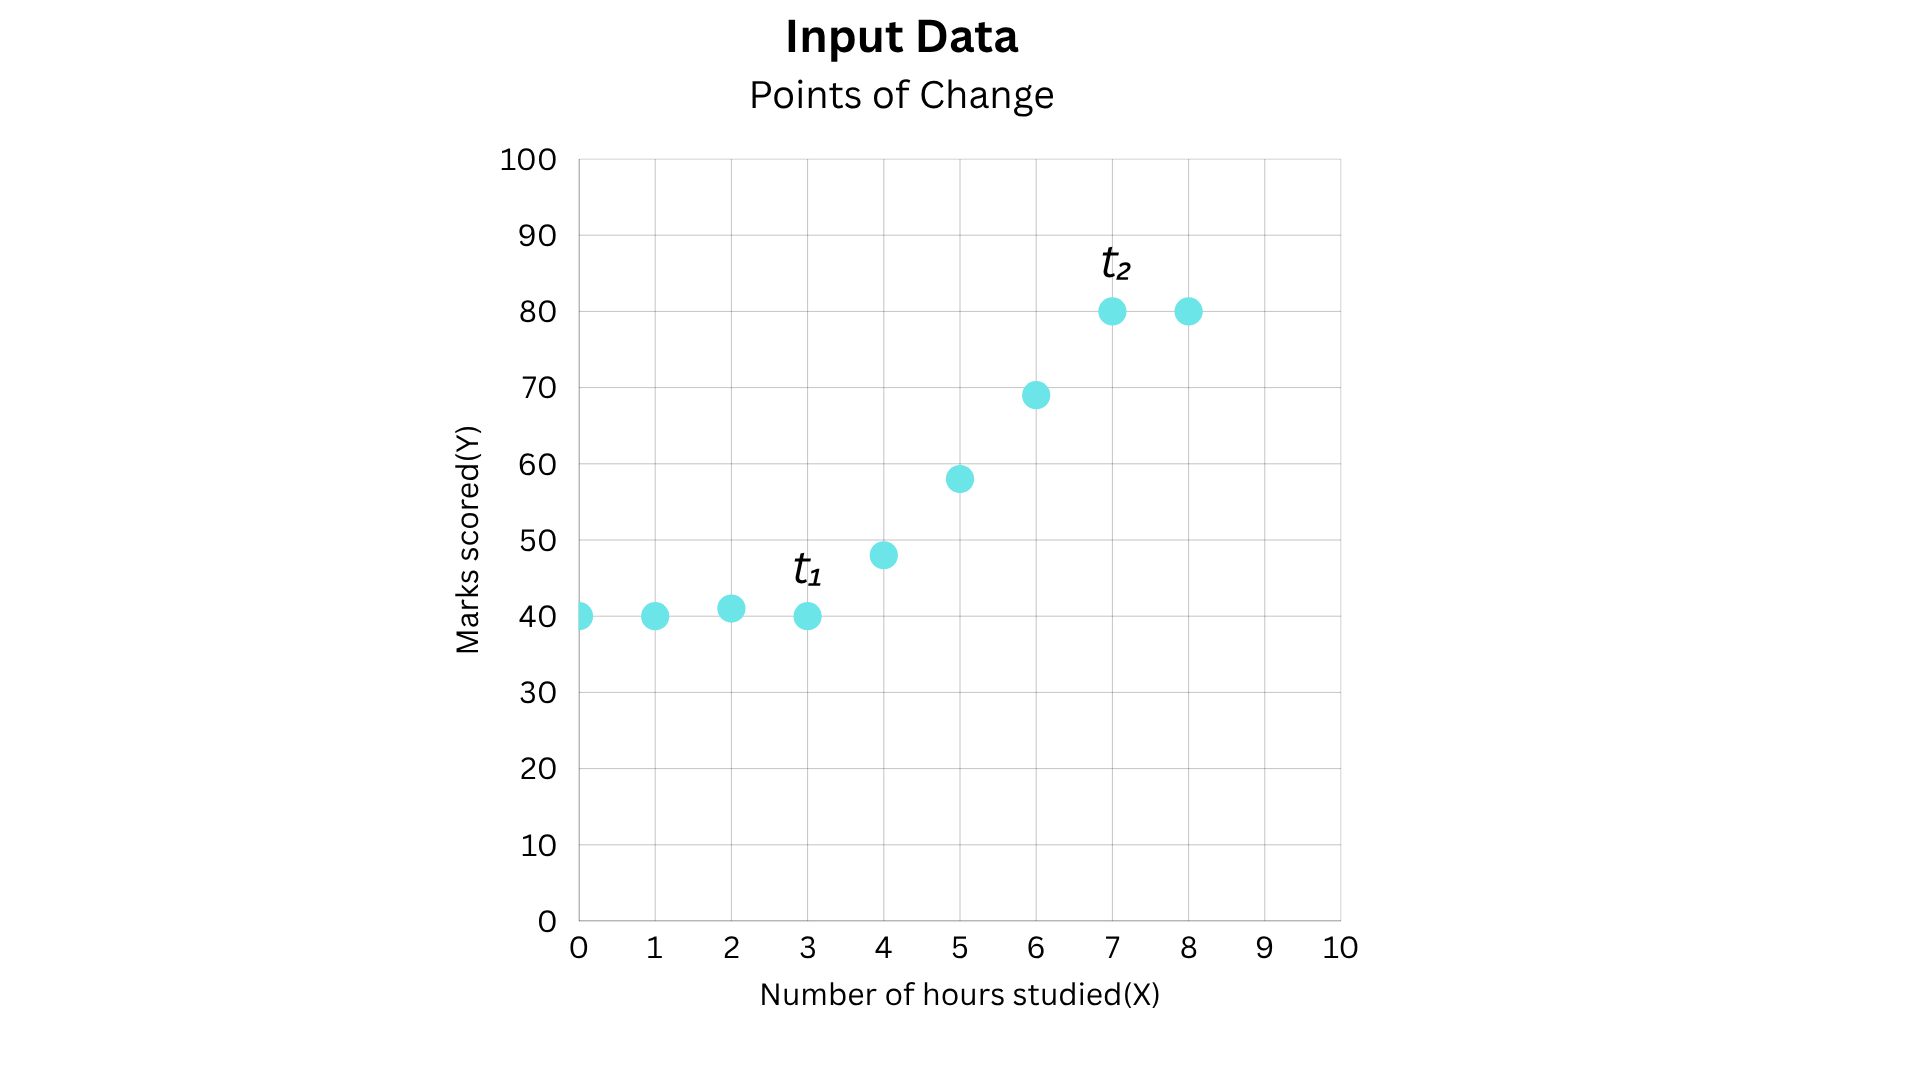
Because Ms. Poly’s linear equation assumes a constant rate of change across the entire domain, it proves insufficient for capturing these distinct operational phases. Instead, the relationship can be segmented into three distinct behavioral ranges: an initial phase where marks remain constant for low study hours, an intermediate phase where marks increase proportionally with study time, and a final phase where marks flatten out at a maximum capacity.
To model this accurately, the underlying logic must adapt to different ranges of input, shifting away from a singular global rule toward a segmented approach. This realization introduces the fundamental concept of non-linearity, where the governing rules of a system change depending on the magnitude of the input.
Piecewise Linear Curves and the ReLU Function
To manage changing patterns without relying on overly complex mathematics, analysts often employ a piecewise linear function. By dividing the input domain into specific regions, an investigator can approximate complex curves using a combination of simpler straight-line segments. For instance, Ms. Poly could separate study hours into two primary regions: an initial region of low study hours where the slope approximates zero because scores hover near a baseline, and a secondary region characterized by a steep upward slope reflecting score improvements.
While each individual segment functions as a straight line, their combination yields an overall relationship that is decidedly non-linear. The governing equation changes dynamically once the input variable crosses a predetermined numerical threshold. This exact principle underpins one of the most widely utilized activation functions in deep learning: the Rectified Linear Unit, commonly known as ReLU.
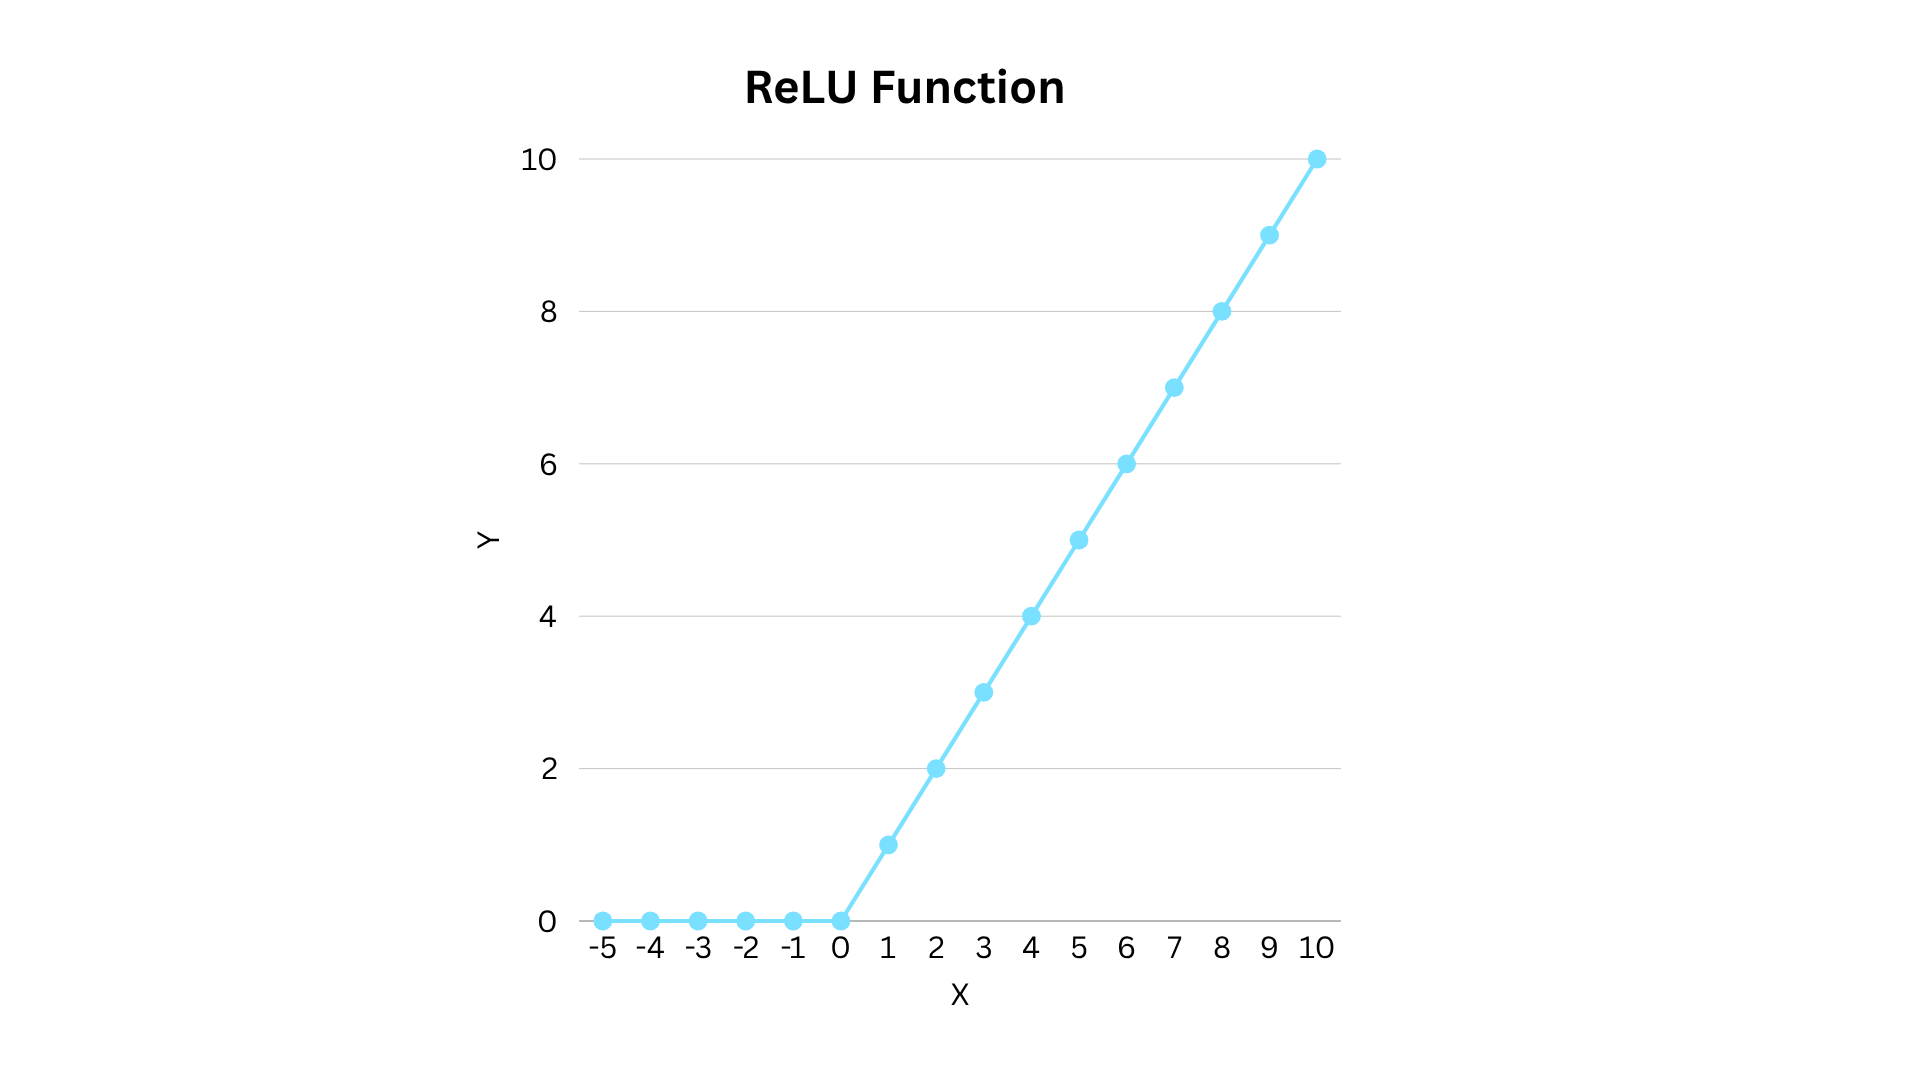
Mathematically defined as $y = textReLU(x) = max(0, x)$, the ReLU function preserves positive input values while converting all negative inputs to zero. Although its components remain linear, the resulting function introduces vital non-linearity into a network. This operational shift allows an individual neuron to react selectively to different input ranges, freeing neural networks from the rigid constraints of a single global line.
S-Shaped Curves and the Sigmoid Function
While piecewise linear curves offer an effective approximation, transitions between distinct operational phases in real-world data are often smooth rather than abrupt. Recognizing that student performance transitions gradually from baseline scores to improvement phases and finally to performance caps, an analyst might alternatively sketch a continuous, smooth S-shaped curve passing through the observed data points.
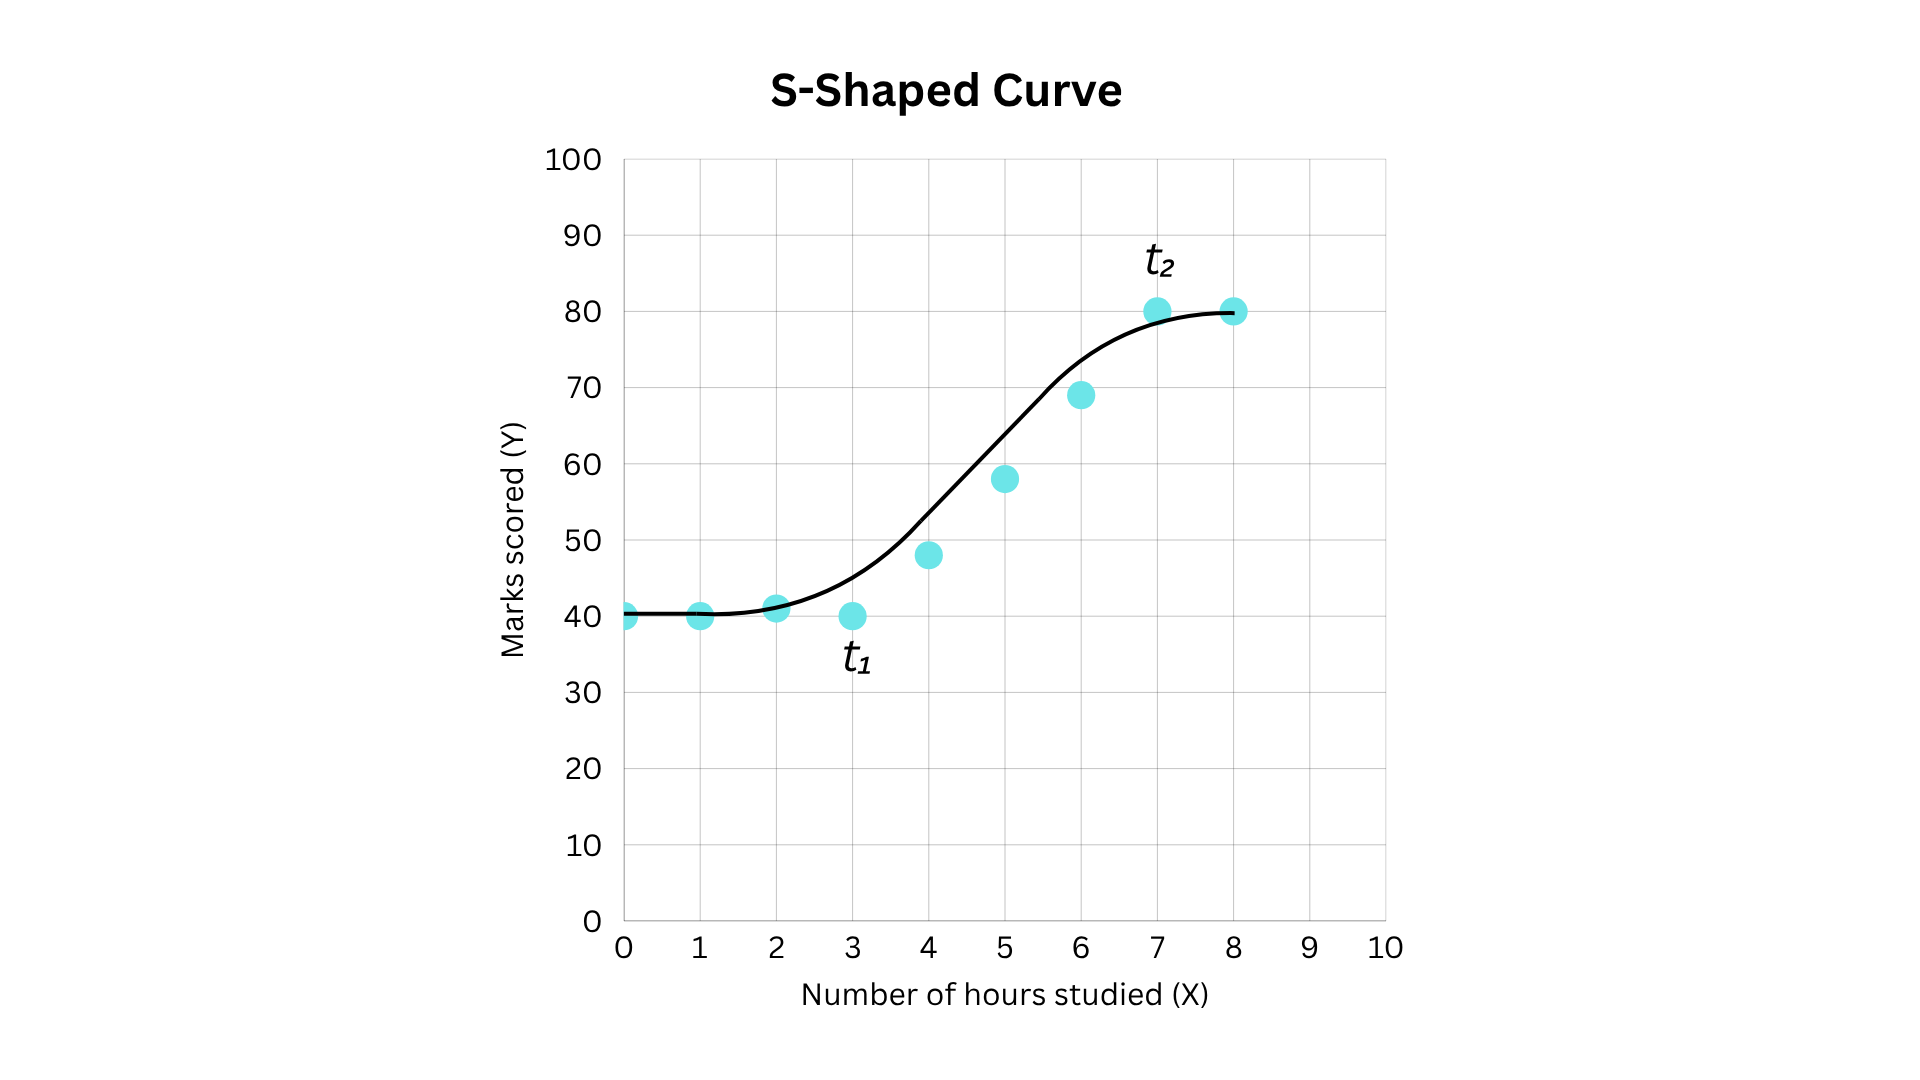
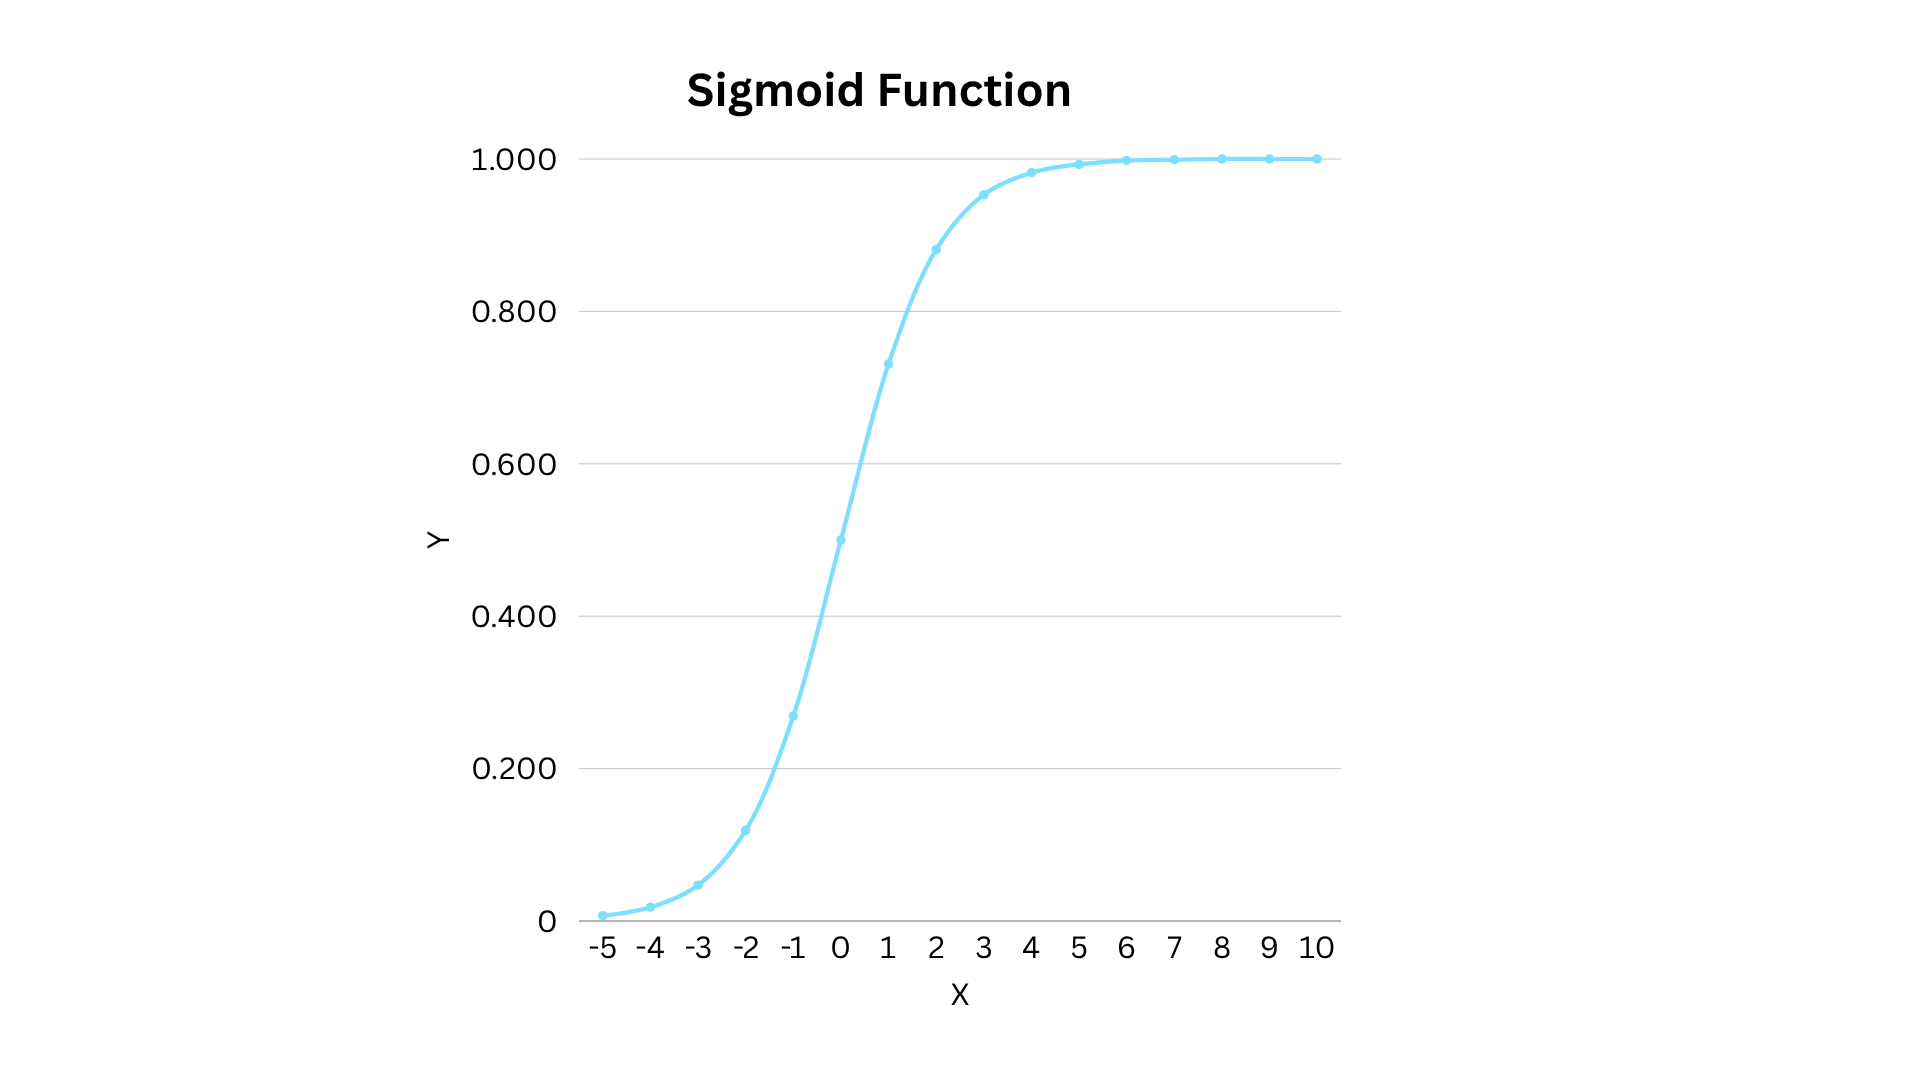
This smooth trajectory reflects a gradual accumulation of knowledge, where initial study hours yield minimal visible change, intermediate hours produce a sharp performance increase, and advanced hours level off as students reach peak capacity. Mathematically, this smooth, S-shaped progression is frequently represented by the sigmoid function.
The sigmoid function maps any real-valued input into a constrained range between zero and one, beginning near zero, accelerating rapidly through the center, and asymptotically leveling off near one. By introducing non-linearity while simultaneously bounding outputs, the sigmoid function proves exceptionally valuable when models need to generate probability estimates, such as calculating the mathematical likelihood of a student passing or failing an examination.
Modeling a Deep Learning Approach
To demonstrate how these mathematical components operate within an architecture, consider how an untrained neural network processes information using manually designated weights and biases. While operational networks typically learn these parameters autonomously through iterative training cycles that minimize prediction error, illustrative models offer clear insights into computational mechanics.
Using a ReLU-based network, an investigator can set up a hidden layer that adjusts input study hours before passing them to an output layer. For a student who studies for five hours, the network calculates an intermediate activation value and subsequently scales it to generate a predicted score. Comparing these network-generated estimates against actual datasets reveals close approximations that successfully capture the upward trajectory of performance without collapsing into a rigid straight-line constraint.
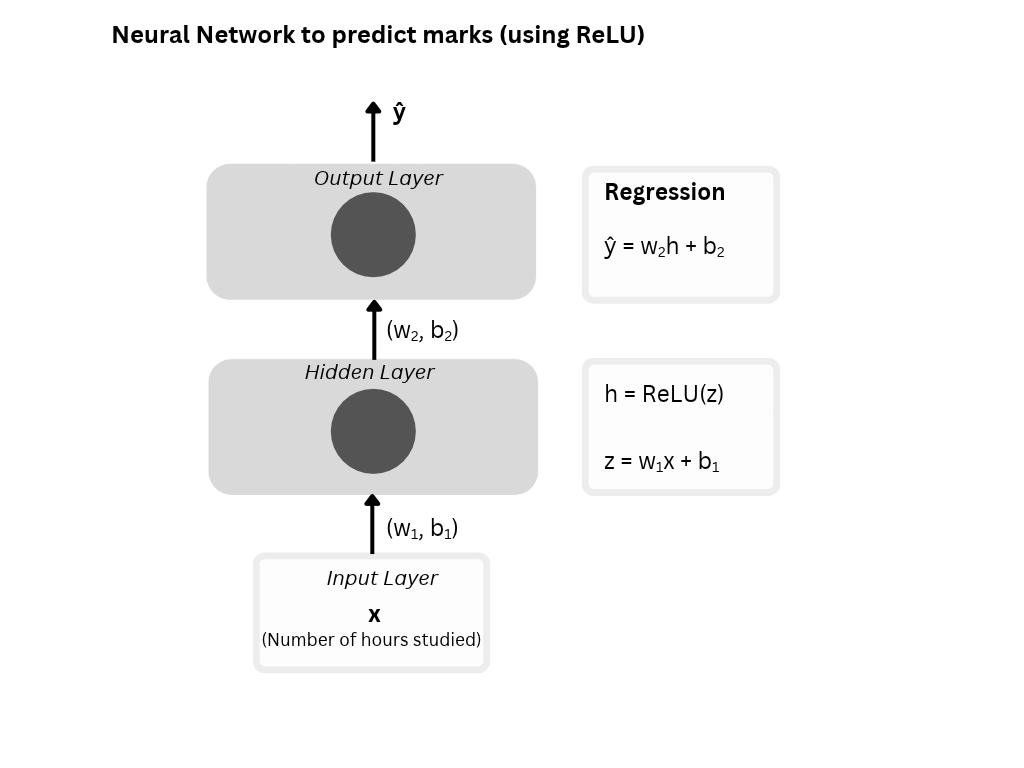
When adapting the network to classification tasks, such as predicting whether a student will pass or fail based on a predetermined threshold of fifty marks, both ReLU and sigmoid functions work in tandem. The ReLU activation handles feature transformation within the hidden layer, while the sigmoid function converts the resulting score into a probabilistic output bounded between zero and one. Probabilities falling below a set threshold categorize the outcome as a failure, whereas values exceeding that boundary classify the result as a success.
Through these applications, neural networks demonstrate a capacity to mirror the complexities inherent in real-world information. While straight-line equations remain useful for modeling consistent, uniform relationships, the integration of non-linear functions enables modern computational models to successfully interpret the nuanced patterns that define real-world datasets.