










Data analysis often evokes images of massive, enterprise-grade databases, complex calculus, and advanced machine learning algorithms running on supercomputers. For many newcomers, the field feels walled off behind high barriers of entry, requiring years of specialized mathematical training before a single useful insight can be extracted. However, industry trends show that many of the most practical and impactful data analysis tasks begin with a much more accessible approach: loading a straightforward dataset, formulating targeted questions, and leveraging modern programming tools to find the answers.
Recent developments in the Python ecosystem continue to lower these barriers, allowing developers and analysts to build lightweight, reusable data analyzers using foundational libraries like pandas and Matplotlib. Rather than relying on rigid, out-of-the-box software packages, professionals and hobbyists alike are turning to custom scripts to process comma-separated value files, commonly known as CSVs, to uncover hidden trends in everything from student academic performance to business metrics.
Setting the Stage with Python and Pandas
At the heart of this movement is pandas, an open-source data manipulation and analysis library built for the Python programming language. By introducing data structures like the DataFrame—which functions essentially as a programmable spreadsheet equipped with rows and columns—pandas allows users to interact with tabular data programmatically.

To operationalize this approach, developers typically begin by establishing a clean workspace containing a Python script and a sample dataset. For illustrative purposes, practitioners often rely on simulated records, such as a fictional student performance log tracking metrics across grades nine through twelve. Each entry captures distinct attributes, including study hours, attendance percentages, and final test scores, providing enough variability to test hypotheses about academic success.

While such synthetic datasets are intentionally simplified and cannot be used to draw sweeping conclusions about real-world populations, they offer a reliable sandbox for mastering core analytical workflows. Analysts can quickly move from raw text files to structured dataframes using basic input commands, immediately unlocking the ability to inspect data integrity, view initial rows, and verify dataset dimensions.
Exploring and Summarizing Complex Information
Before diving into advanced modeling, experienced data professionals emphasize the importance of thorough exploratory data analysis. This initial phase involves checking dataset sizes, examining column data types, and identifying potential anomalies or missing values that could distort subsequent findings.
Using built-in statistical methods, analysts can bypass manual mathematical calculations to instantly derive key metrics such as arithmetic means, medians, minimums, and maximum values. For instance, determining the average test score or generating a comprehensive statistical summary of numerical columns can be achieved with single-line commands. These summaries provide an immediate baseline, helping users spot outliers or skewed distributions before committing to deeper investigations.
Furthermore, pandas excels at conditional data filtering, enabling users to isolate specific subsets of records with remarkable precision. Analysts can effortlessly query a dataset to isolate high-performing individuals, filter for specific attendance thresholds, or combine multiple logical conditions to pinpoint exact cohorts of interest. By utilizing index-locating functions, researchers can seamlessly bridge aggregate statistics back to individual records, identifying precisely which data point corresponds to a maximum or minimum value.
Uncovering Relationships and Visualizing Trends
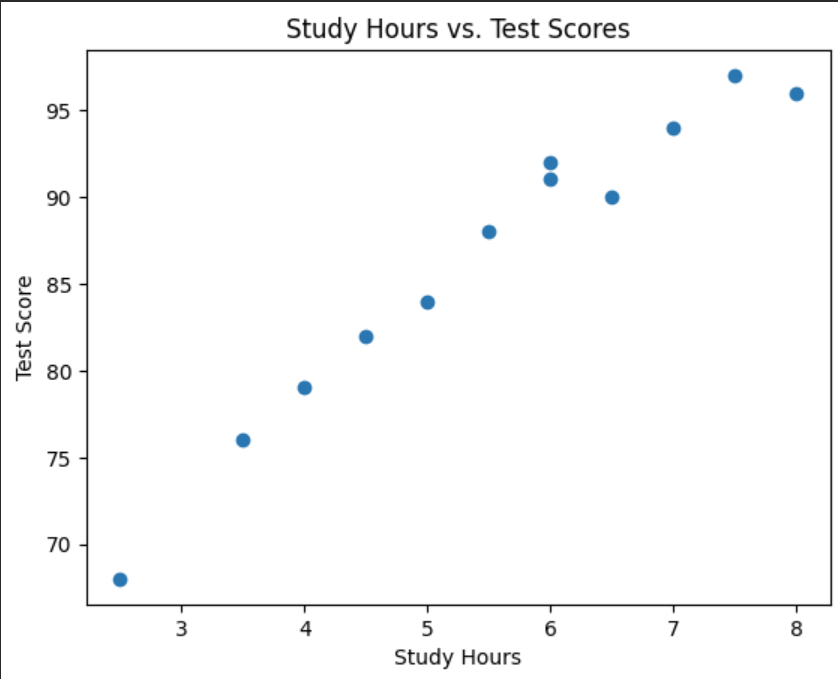
Beyond basic summarization, custom data analyzers allow users to explore relationships between distinct variables. By employing built-in correlation methods, analysts can measure the strength of linear associations—such as the relationship between study hours and academic test scores. While experts continually caution that correlation does not establish direct causation, identifying these numerical relationships provides a valuable starting point for deeper investigation.
To communicate these findings effectively, developers frequently integrate visualization libraries like Matplotlib directly into their analysis pipelines. Transforming raw numbers into scatter plots and bar charts allows stakeholders to visualize trends instantly. A scatter plot mapping study hours against test scores, for instance, provides a visual narrative of performance distribution, while bar charts clearly delineate average scores across different grade levels.
As these scripts mature, developers often refactor their code into reusable functions, transforming ad-hoc scripts into modular analysis tools. By encapsulating repetitive tasks—such as calculating summary statistics or filtering top-performing records—into clean functions, users build flexible foundations capable of handling diverse datasets. Additional error-handling logic for missing values and export utilities to save cleaned data back into CSV formats further professionalize the workflow.
Ultimately, the ability to construct a functional data analyzer using Python demonstrates that powerful insights do not always require complex architecture. By mastering fundamental libraries and adopting a systematic approach to data exploration, developers can unlock the value hidden within everyday datasets, paving the way for more sophisticated data projects in the future.