










Building data visualizations for modern web applications has long been a notoriously tedious task for front-end developers. While UI libraries like shadcn/ui and data visualization engines like Recharts have made tremendous strides in making dashboards visually appealing and responsive, the underlying configuration overhead remains a common hurdle. Developers frequently find themselves sorting through dense documentation, manually setting up color variables, custom axes, tooltips, legends, and resizing containers, often resorting to copying and pasting boilerplate code from previous projects.
To address this persistent friction, a developer has introduced ChartCN, a free, open-source generator specifically designed to streamline the implementation of shadcn charts in Next.js environments. Released under an MIT license without requiring user accounts or additional package installations, the tool aims to eliminate repetitive setup tasks by converting raw data sets directly into production-ready TSX components.
The core motivation behind the tool stems from how charts are typically handled in production workflows. While the official shadcn/ui chart component successfully wraps Recharts to provide theme-aware styling and native tooltips, developers still face the burden of writing every chart structure by hand. ChartCN bridges this gap by allowing creators to input their data, customize chart parameters, and copy a single, self-contained file that relies exclusively on the official shadcn chart ecosystem and Recharts.

The integration process highlights how modern React frameworks handle client-side rendering alongside server-side data fetching. When implementing a revenue-versus-expenses bar chart within a fresh Next.js App Router application, developers begin by establishing a standard environment featuring TypeScript and Tailwind CSS. Initializing the shadcn/ui framework sets up vital CSS variables—specifically five core chart color variables defined in the project’s global stylesheet—which allow visualizations to seamlessly adapt to light and dark mode preferences without requiring manual color overrides for every individual series.
Installing the official shadcn chart component automatically incorporates Recharts and generates the foundational building blocks required for sophisticated layouts. Because Recharts relies heavily on DOM measurements and active event listeners, the resulting visualizations must operate as Client Components. However, Next.js architecture allows the parent pages to remain Server Components, fetching necessary data securely on the backend before passing it down as props.
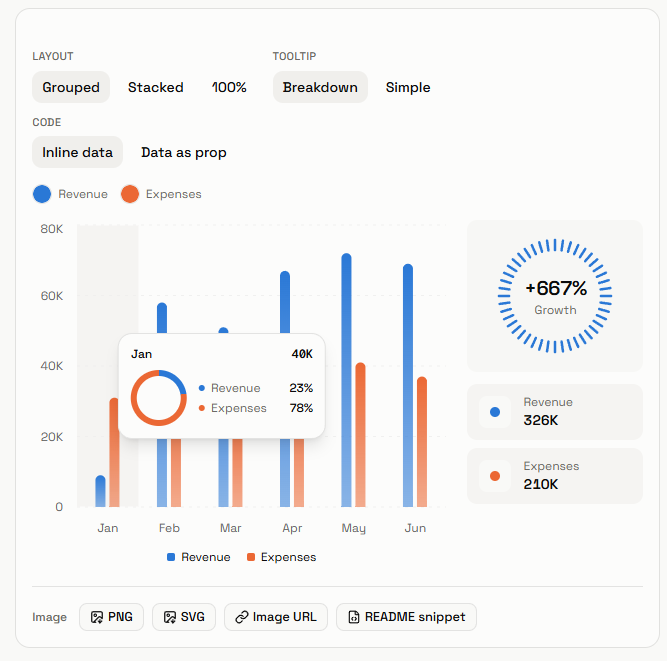
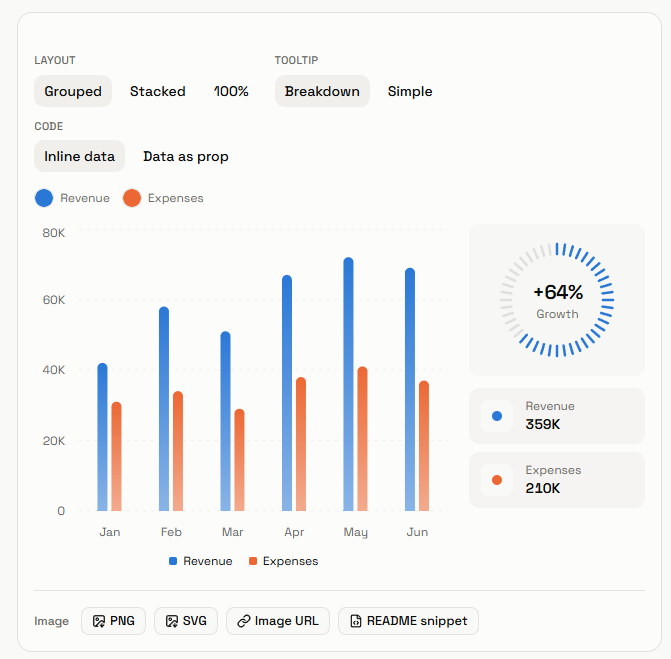
When using ChartCN, developers can input raw data via pasted comma-separated values, uploaded files, or manual table edits. The generator automatically interprets the primary column as the categorical axis while treating subsequent columns as distinct numeric data series. Once the preferred visual options—such as gradients, axis formatting, and tooltips—are selected, the platform produces a complete component file.
Examining the generated code reveals how deeply integrated the theme variables are with the visualization layer. The configuration object maps data keys directly to cascading style variables, ensuring that color inheritance is handled cleanly at the container level. Furthermore, advanced features like gradient fills, custom shape renderers, and responsive grid layouts are included by default, significantly reducing the amount of manual styling required to achieve a polished interface.
For enterprise environments handling live, dynamic information, the tool supports passing data through strongly typed props. This ensures that real-world scenarios—such as dealing with incomplete data sets or null values where a specific metric might be missing—are handled gracefully by rendering gaps rather than defaulting to zero, thereby preserving the integrity of financial or analytical dashboards.
By keeping data-fetching logic isolated within server-side components and passing strictly typed rows to client-side rendering boundaries, development teams can maintain robust security standards while keeping database credentials and API keys completely out of the client bundle. This architectural separation aligns closely with modern React and Next.js best practices, ensuring that applications remain performant and secure as they scale.
The release of ChartCN underscores a broader industry trend toward reducing boilerplate fatigue in component-driven development. By offering a streamlined workflow for the ecosystem’s most popular visualization tools, the project provides an accessible alternative for engineers looking to accelerate dashboard development without sacrificing customization or control. The complete source code and template library remain publicly available for community contribution and adoption.