












Understanding the inner workings of a neural network often begins with a fundamental mathematical concept: the straight-line equation. In basic linear models, relationships are defined by a constant rate of change, offering a reliable starting point for predicting outcomes when input and output variables maintain a steady, predictable pace. However, the real world rarely adheres to such geometric simplicity. In practice, data is rarely linear, and relying on a single, uniform rule frequently falls short when attempting to capture dynamic, multifaceted behaviors.
To bridge the gap between simple linear assumptions and the messy reality of real-world information, data scientists rely on non-linearity. This critical mathematical property empowers neural networks to adapt, shifting their responsiveness depending on the range of the input data. By moving past rigid straight lines, networks can approximate intricate curves, piecewise functions, and probabilistic thresholds, paving the way for advanced machine learning architectures capable of solving complex problems.
When a Straight Line Is Enough
To appreciate the necessity of non-linear functions, it helps to examine scenarios where a linear approach appears adequate on the surface. A standard straight-line equation posits that the same governing rule applies universally across every data point. Expressed mathematically as $y = ax + b$, the formula defines the output variable $y$ in terms of the input variable $x$, where $a$ represents the slope—the magnitude of change in $y$ for a given shift in $x$—and $b$ represents the $y$-intercept, or the baseline value when the input is zero.

Consider the pedagogical framework of Ms. Poly, a mathematics educator seeking to optimize a study plan for her students ahead of a high-stakes final examination. Attempting to establish a straightforward rule of thumb, she hypothesizes that a student’s grade is directly proportional to the number of hours they dedicate to studying each week. In this context, the slope signifies the marginal academic improvement gained per hour of study, while the intercept denotes a baseline score achievable even without independent preparation.
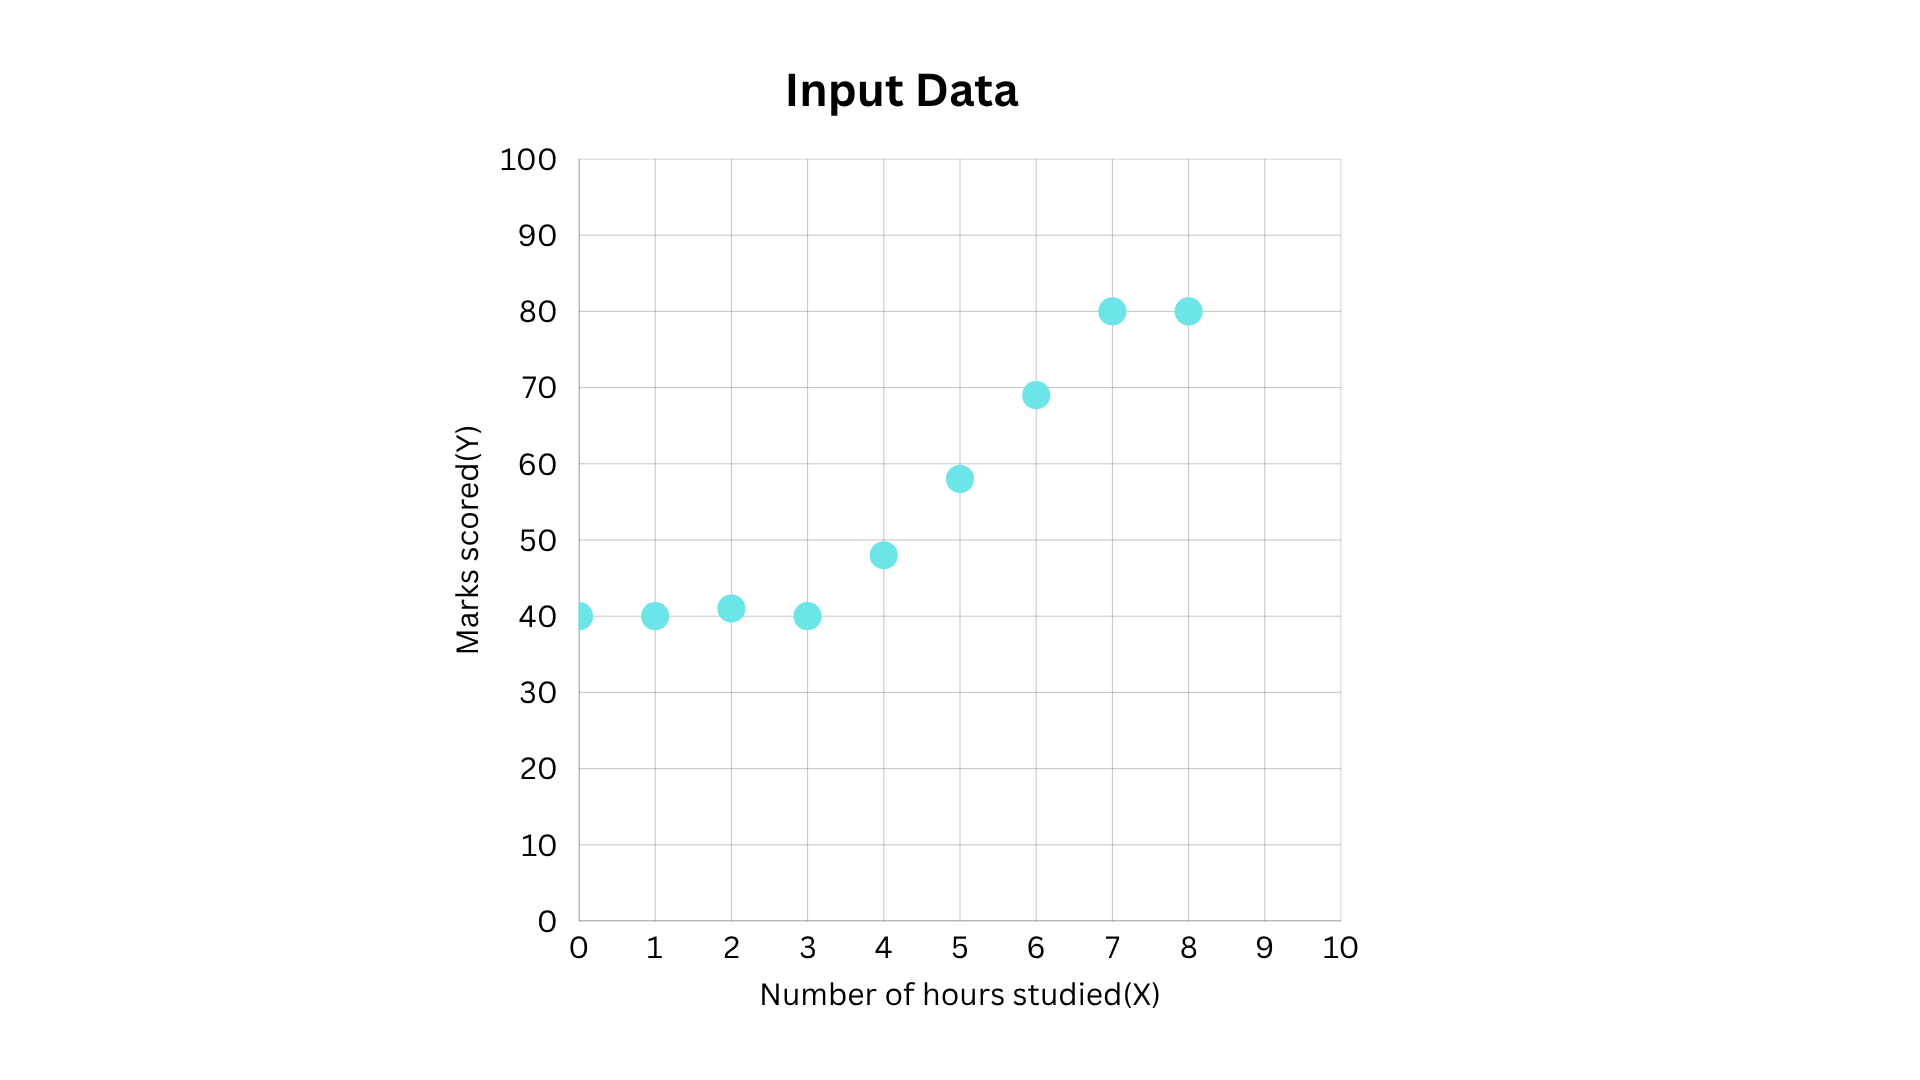
Following a quarterly assessment, Ms. Poly surveys her students to gather empirical data, plotting weekly study hours against final test scores. Naturally, she organizes the metrics into comparative pairings, tracking hours against marks ranging from zero to eight hours per week. Yet, upon attempting to fit her straight-line hypothesis to the collected observations, a discrepancy emerges. The real-world performance metrics refuse to align neatly with the rigid, uniform trajectory of a single linear equation, demonstrating once again that natural human behavior defies simplistic geometric modeling.
When a Straight Line Isn’t Enough
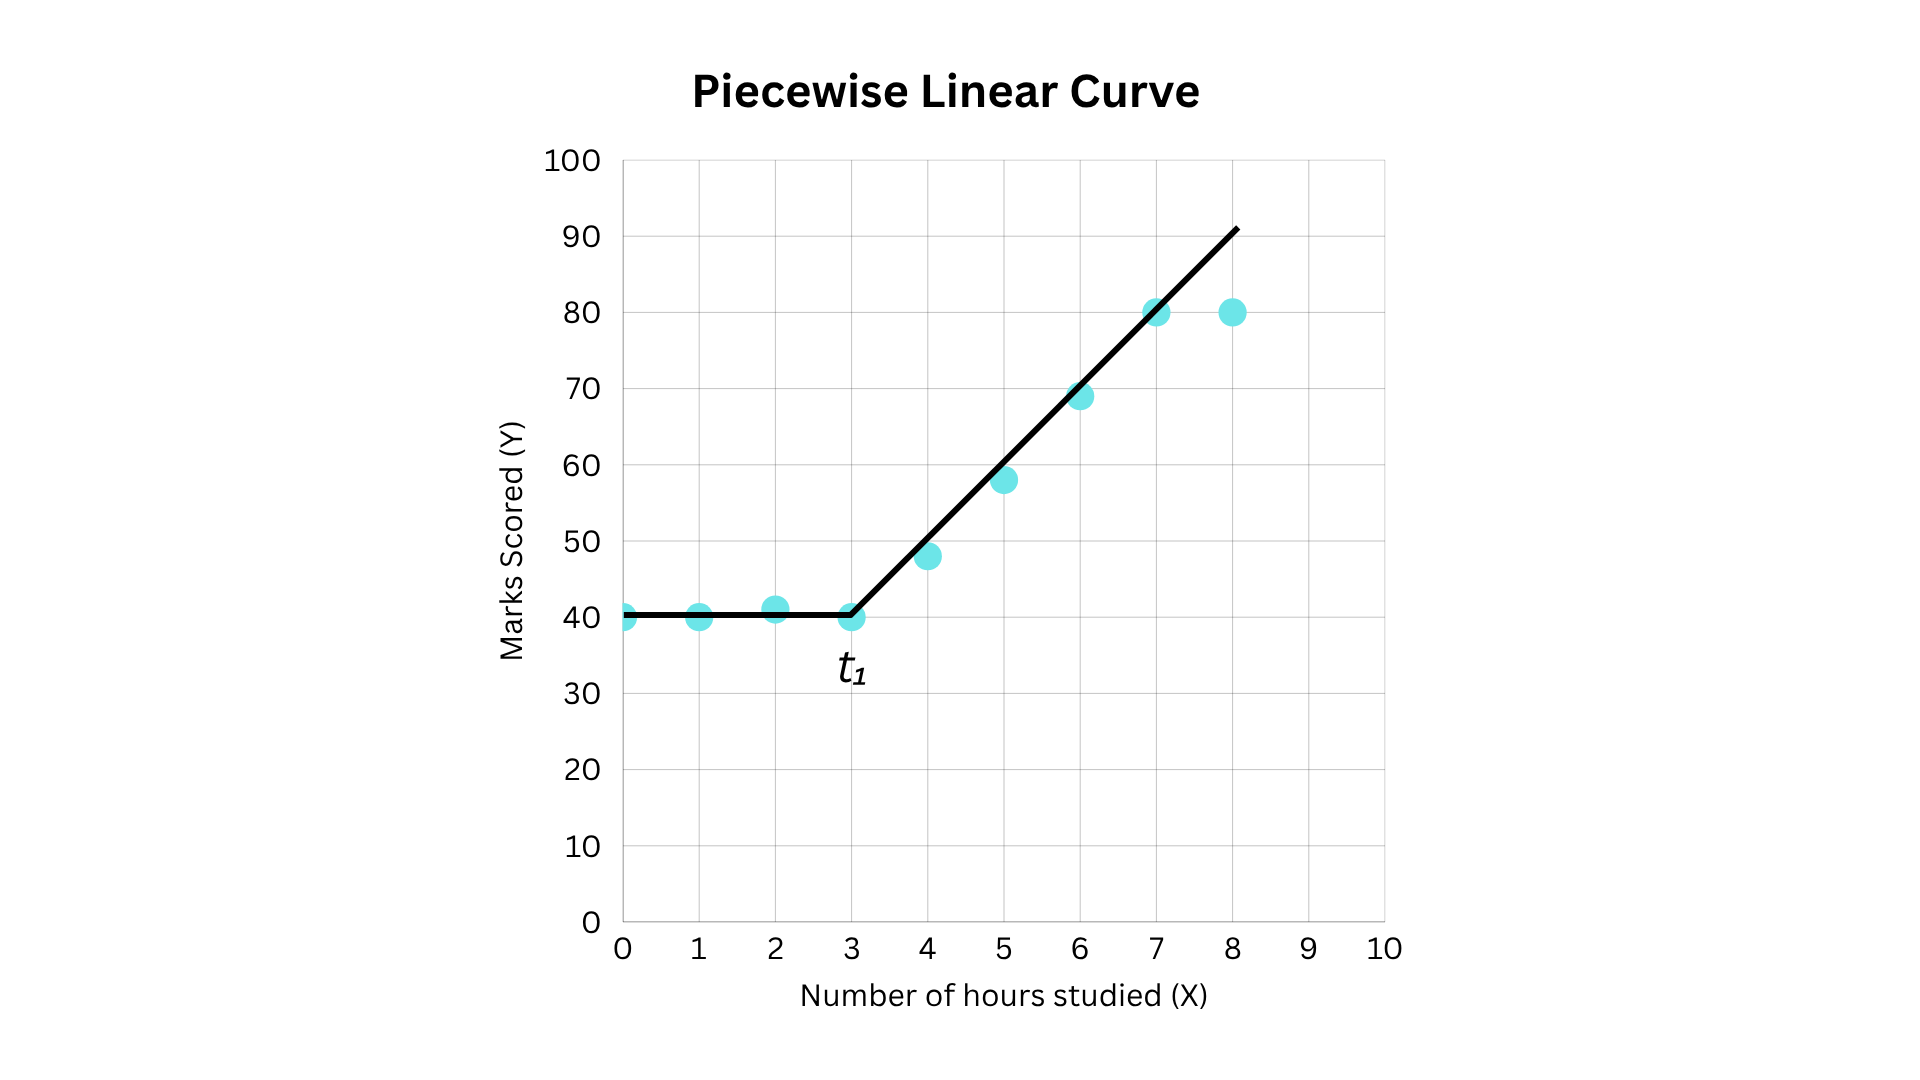
A closer inspection of the graphical distribution reveals distinct behavioral phases among the student cohort. Individuals who invest only a minimal number of study hours display negligible score improvements. Once a specific threshold of preparation is crossed, however, performance begins an upward climb, with additional hours translating directly into higher marks. Yet, this upward trend does not continue indefinitely; beyond a subsequent upper threshold, further study yields diminishing returns, and scores plateau.
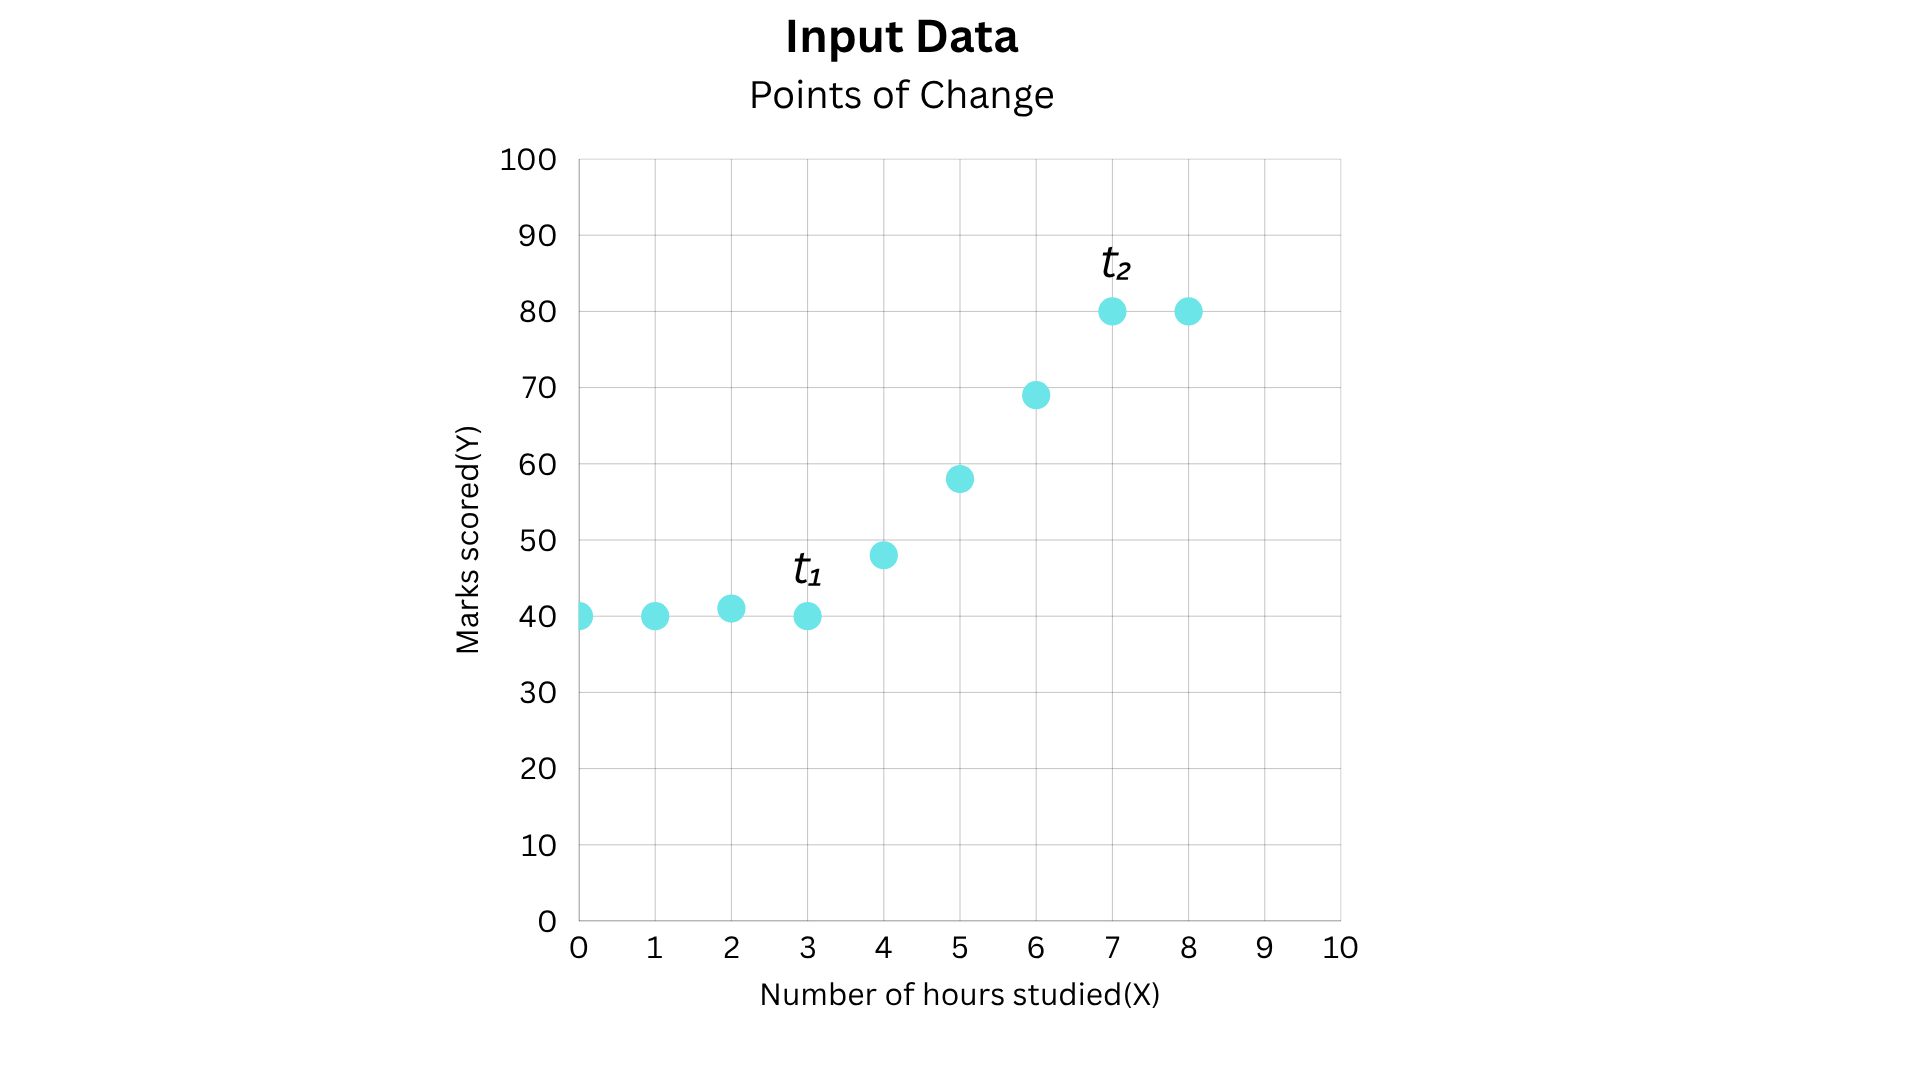
Because the underlying relationship between study hours and academic performance shifts across different intervals, a single straight-line equation proves entirely insufficient. Instead, the dataset naturally fragments into three distinct operational zones: low study times where marks remain stagnant, intermediate intervals characterized by proportional growth, and higher study durations where performance stabilizes once more.
To accommodate these shifts, analysts turn to piecewise linear functions, which apply different equations across specified ranges of the input variable. By breaking a complex curve down into manageable linear segments, the overarching model abandons the restriction of a single rule, allowing the mathematical description of the data to adapt as the input crosses predetermined boundaries.
Piecewise Linear Curves and the ReLU Function
For the sake of simplicity, Ms. Poly initially divides her observations into two primary regions: study hours falling below a critical threshold and those meeting or exceeding it. Within the lower region, test scores hover near a baseline average, permitting an approximation represented by a slope of zero. In the upper region, a marked positive slope captures the steep upward trajectory of student performance.
Although each individual segment resembles a straight line, their combination yields a non-linear composite structure. When the input variable crosses a specific boundary, the governing equation changes entirely. This fundamental technique underpins one of the most widely implemented activation functions in contemporary neural networks: the Rectified Linear Unit, commonly known as ReLU.
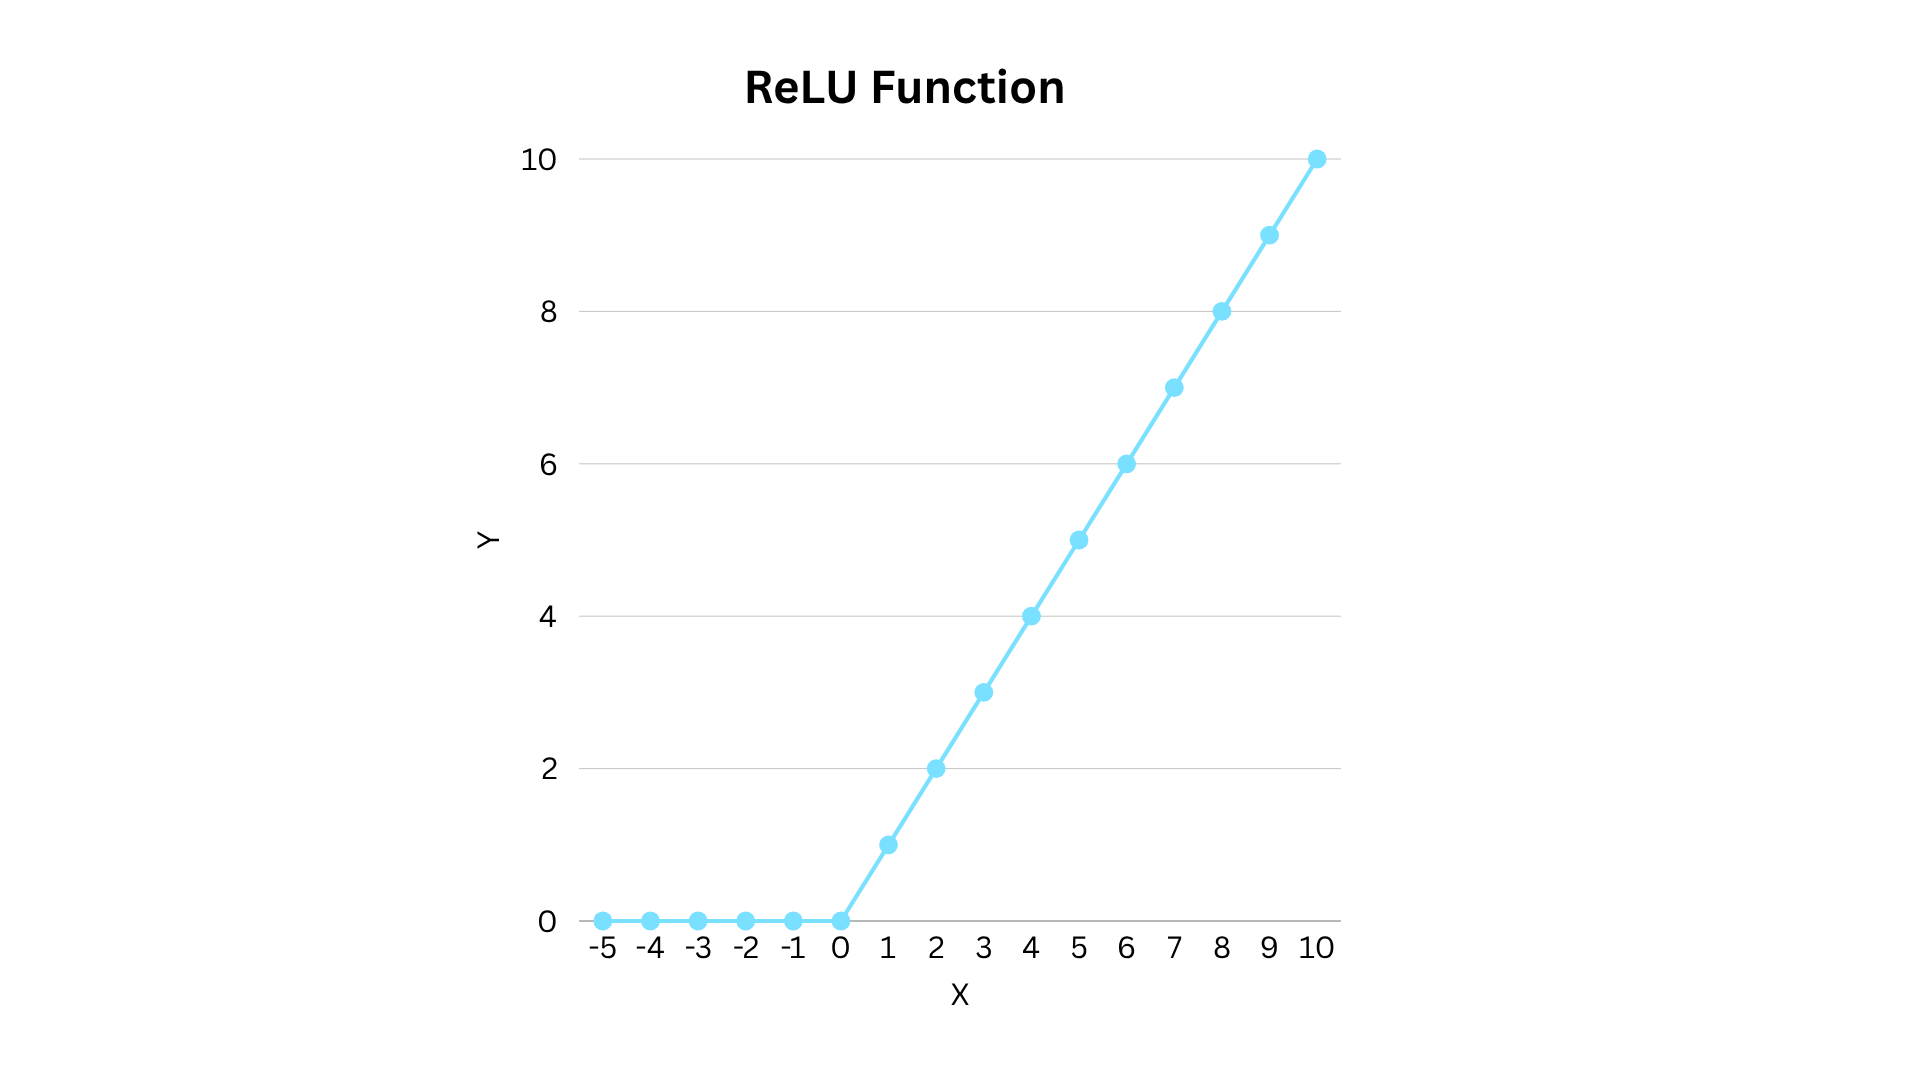
Mathematically defined as the maximum of zero and the input value, the ReLU function leaves positive inputs completely unaltered while collapsing negative inputs to zero. While its individual components remain linear, the resulting aggregate function introduces crucial non-linearity into the network architecture. This straightforward mechanism enables individual neurons to alter their responsiveness based on varying input magnitudes, equipping artificial intelligence models with the flexibility to transcend the limitations of traditional linear regression.
S-Shaped Curves and the Sigmoid Function
While piecewise linear approximations successfully capture shifting behaviors, they rely on sharp, angular transitions between distinct operational zones. In many natural systems, however, changes occur smoothly and continuously rather than abruptly. To reflect this continuity, analysts frequently substitute angular segments with smooth, continuous curves that gently trace the trajectory of the underlying data points.
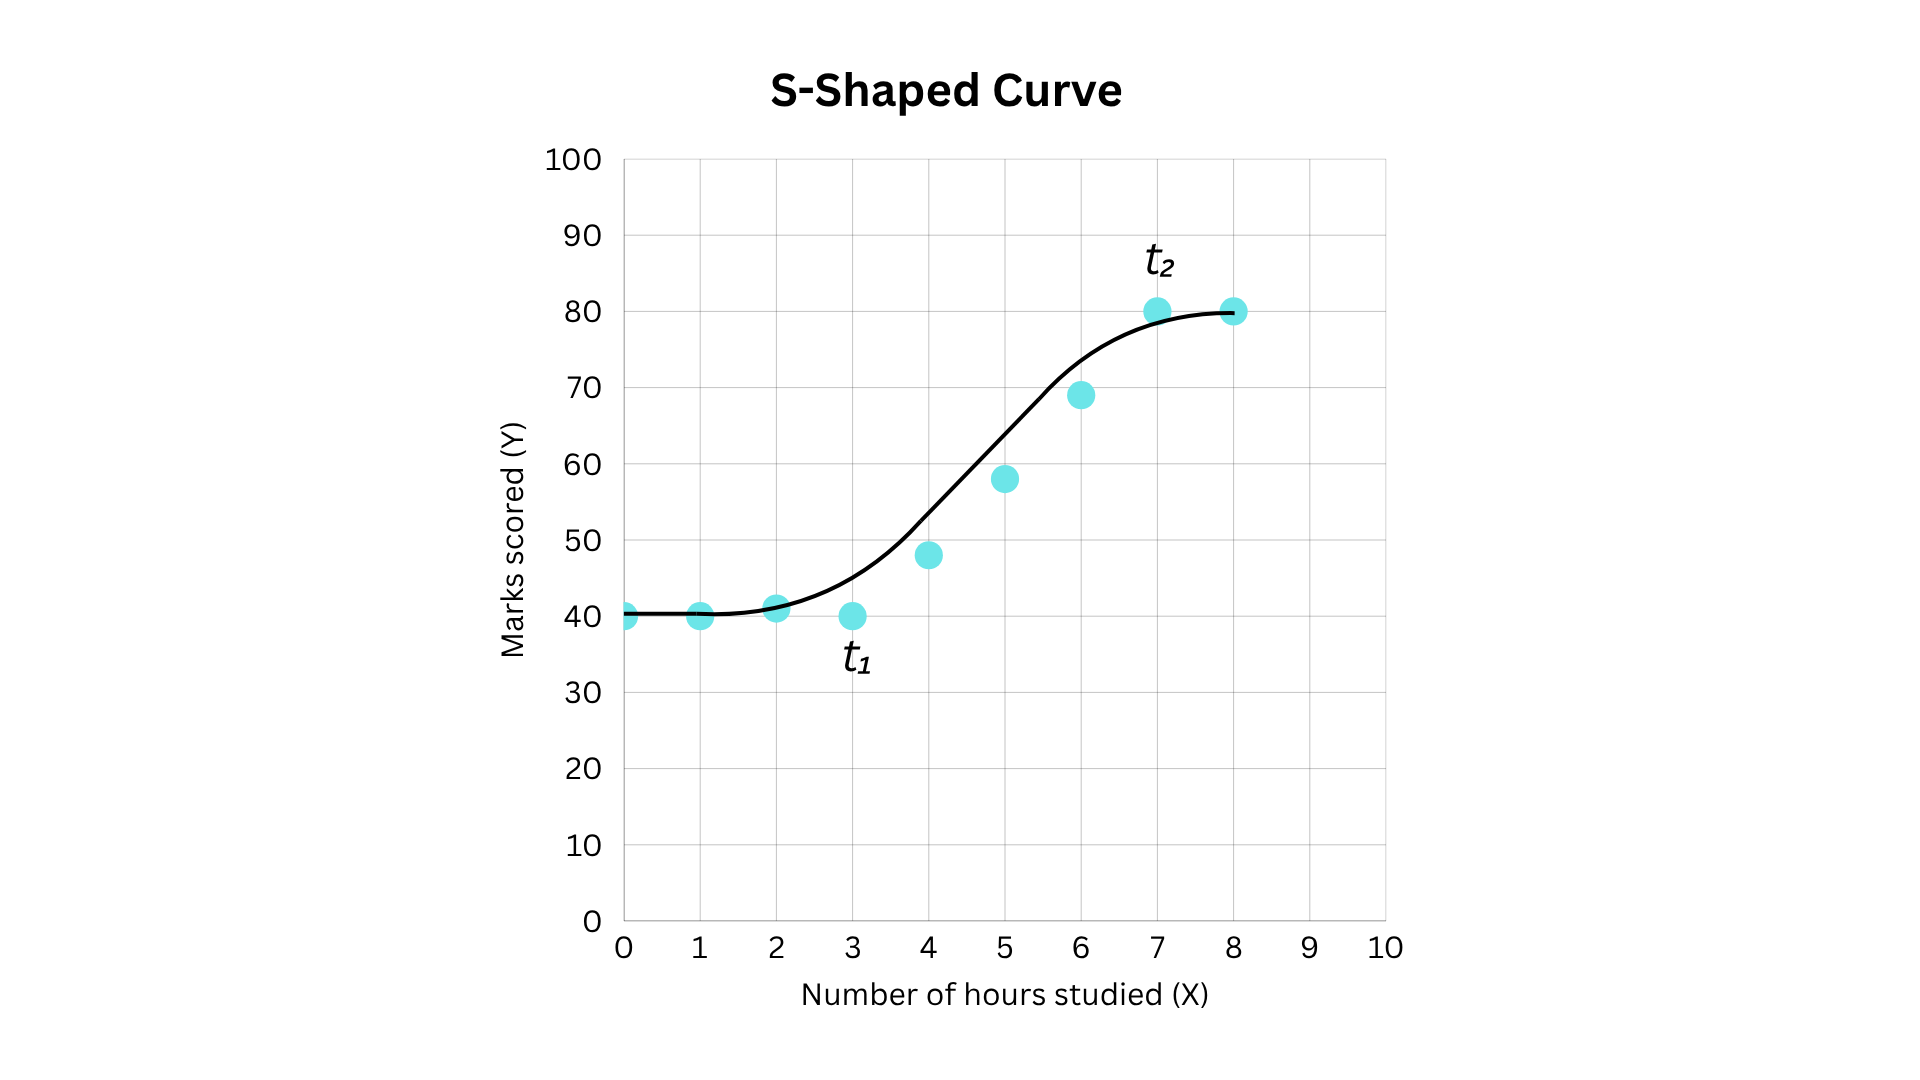
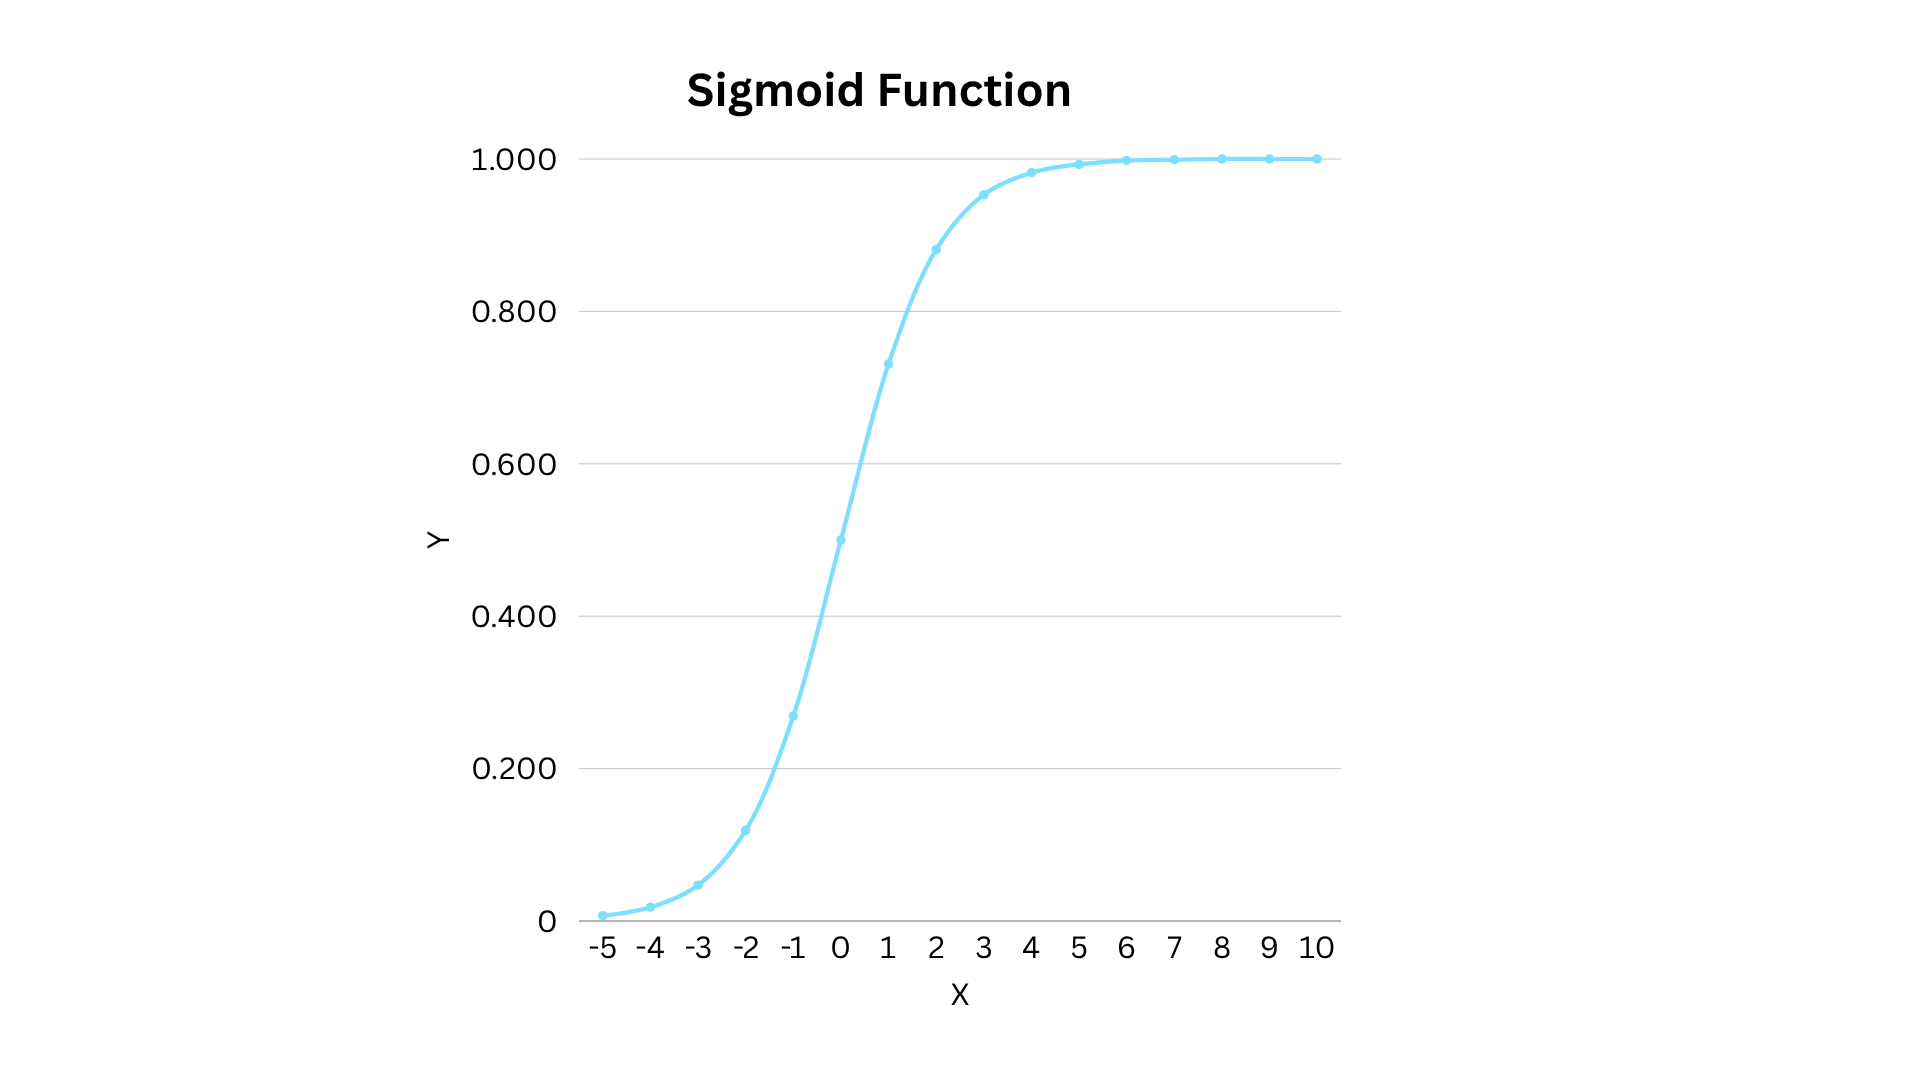
This smooth, continuous progression resembles an elongated S-shape, capturing a gradual baseline, an accelerated period of growth in the intermediate phase, and a subsequent asymptotic plateau. In mathematical modeling, this characteristic curve is frequently generated using the sigmoid function. By mapping any real-valued input onto a restricted range between zero and one, the sigmoid function accommodates gradual transitions that accelerate near the center before leveling off.
The sigmoid function holds profound significance within neural network design because it introduces non-linear dynamics while simultaneously bounding its output. This dual capability makes it exceptionally valuable for tasks requiring probabilistic interpretations, such as determining the likelihood of a student passing an exam. Higher function outputs denote an increased probability of success, transforming raw computational values into interpretable metrics.
Modeling a Deep Neural Network
To observe these theoretical principles in action, analysts can construct rudimentary, untrained neural networks utilizing manually assigned weights and biases. While production models rely on automated optimization algorithms—iteratively comparing predictions against ground-truth data to minimize error—manual configurations serve as effective illustrations of underlying computational mechanics.
By pairing linear transformations with non-linear activation functions such as ReLU and sigmoid, a network can successfully model complex phenomena. For instance, configuring a network to predict specific numerical scores involves passing an input through a weighted linear equation, applying the ReLU activation to introduce non-linearity, and scaling the result through a subsequent linear layer. When evaluated against empirical student data, the network’s generated predictions closely mirror actual academic outcomes, validating the utility of piecewise linear modeling.
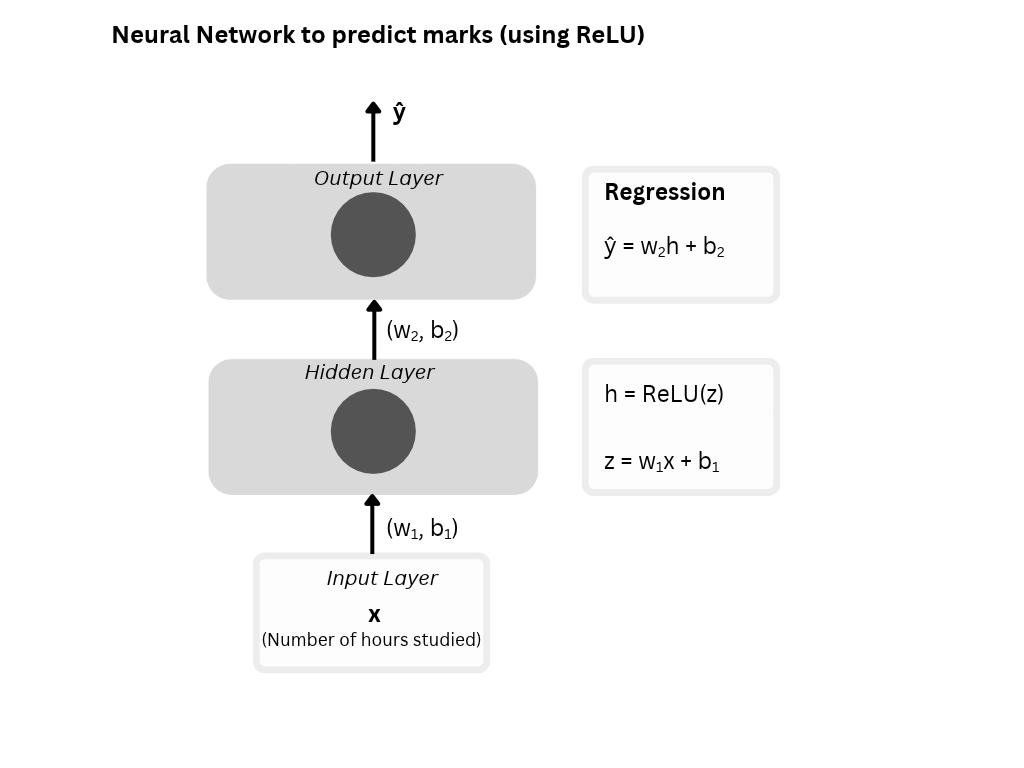
Expanding this architecture to handle classification tasks—such as predicting binary pass or fail outcomes based on a minimum score requirement—demonstrates the collaborative power of ReLU and sigmoid functions. In this dual-layer setup, the hidden layer utilizes ReLU to transform the input features, while the final output layer employs the sigmoid function to generate a probability score. Evaluating these probabilities against established thresholds allows the network to classify student outcomes with high accuracy.
Ultimately, these investigations highlight a foundational truth of machine learning: real-world data rarely conforms to uniform, straight-line rules across all operating conditions. By integrating non-linear activation functions into multi-layered architectures, neural networks acquire the capacity to navigate complex, fragmented relationships, transforming raw inputs into meaningful insights.