










Data visualisation sits at the intersection of two disciplines that historically have rarely spoken to each other: data and design. Across modern organisations, many enterprise dashboards remain technically correct yet communicatively inert. They show the right numbers on a screen, but they consistently fail to produce a meaningful decision, a clear strategic direction, or an actionable change in thinking. UX designer and researcher Meriem Benhabiles has explored what shifts within corporate workflows when teams bring structured UX thinking to dashboards and data presentations—examining everything from the foundational questions asked before opening a tool to the critical product decisions that determine whether an insight actually lands.
In organisations today, quantitative data has never been more available. Dashboards and performance decks exist for almost every corporate function—sales, product development, marketing, and operations—and the software tools used to build them have never been more accessible. And yet, in weekly standup meetings and quarterly review sessions, the exact same scenario plays out repeatedly: an analyst shares the numbers, the room nods in passive agreement, and the meeting concludes without a definitive decision or a clear operational direction.
When that happens, the underlying data almost always takes the blame. Stakeholders complain that the metrics were not granular enough, that the dataset was incomplete, or that leadership needs more information before they can act. But the data is rarely the actual problem. The underlying reality is that nobody designed the interface to deliver actionable insights. The chart was built from whatever data happened to be available, rather than from the specific question that needed answering. The audience was assumed rather than truly understood, and the core question of what should actually change as a result of seeing this data was never asked at all.

Data visualisation and user experience (UX) design are ultimately solving the same underlying problem: both disciplines are trying to move the right information to the right person in a way that changes something. While their vocabularies differ, the underlying challenge is identical. The moment organisations start treating these fields as complementary disciplines is the moment dashboards stop acting as passive collections of static charts and start performing a functional role in business operations. For designers working with complex data, analysts presenting to non-technical stakeholders, and marketers needing their metrics to do more than sit inside a static slide deck, rethinking this approach is critical.
The Chart Was Never The Whole Story
In 1973, statistician Francis Anscombe published a paper that made a quiet but clarifying point. He constructed four datasets that are statistically identical: they share the exact same mean, the same variance, the same correlation coefficient, and the same regression line. Run the raw numbers on any of them, and they are completely identical. Yet, when plotted visually, they could not be more different from one another. Anscombe’s lesson to statisticians was about diagnosis: visualisation reveals the operational truth that raw numbers conceal.
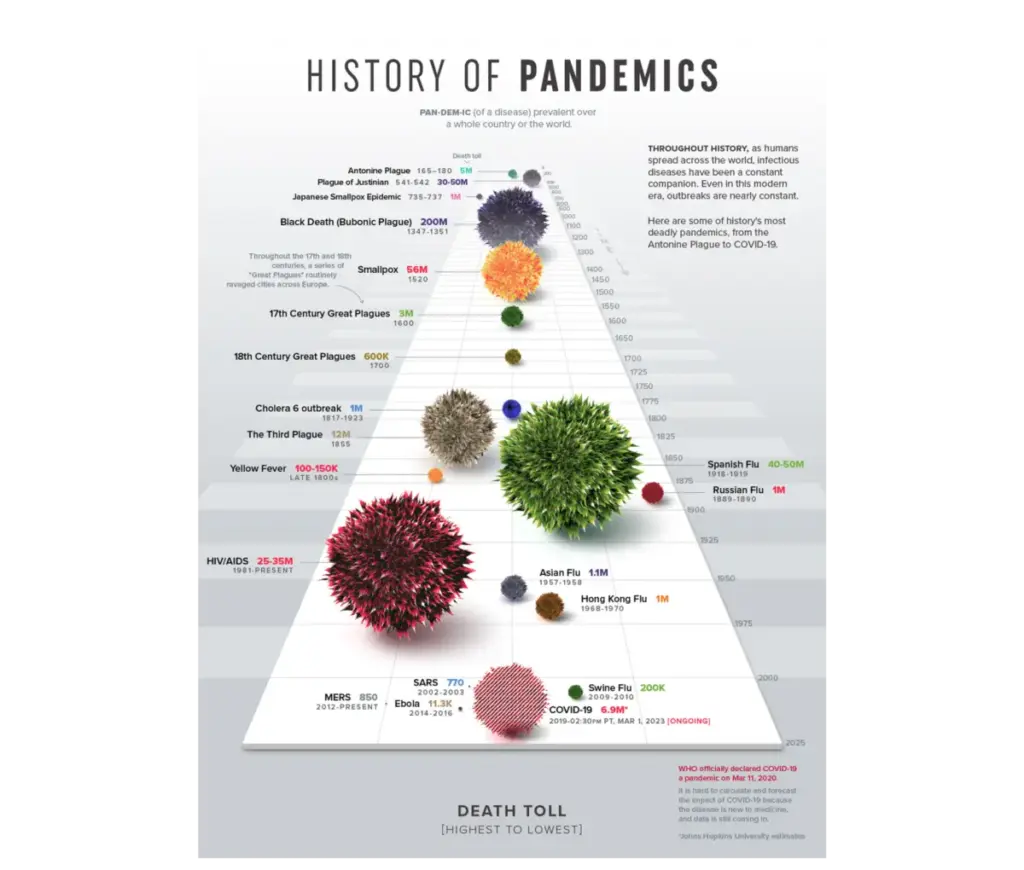
However, visualisation is not only diagnostic; it is also communicative. The visual form chosen by a designer is where true understanding either emerges or gets lost in the noise. Does an audience walk away with a set of abstract numbers, or do they walk away with a compelling story they will quote and discuss? One of the most striking contemporary examples of this communicative power is Visual Capitalist’s History of Pandemics. Instead of burying readers in a massive data table of raw casualty counts, the project maps the death tolls of major historical pandemics using a proportional bubble layout on a single, continuous timeline. Before the human brain even reads a single numeric label, the visual system instantly grasps the sheer scale of the Black Death relative to every other historical event on the page. The right visualisation does not merely plot data points; it makes the underlying story impossible to miss.

Edward Tufte famously codified a foundational principle for the craft with his data-ink ratio, arguing that every mark on a chart should serve the data rather than decorate it. It remains a widely used framework in data visualisation, anchored in the assumption that clarity and visual hygiene are the ultimate goals. For a chart viewed in complete isolation, that holds true. But a chart is never read in total isolation: it is read by a real person, operating in a specific context, under specific professional pressure. Strip a chart down to its absolute cleanest form, and a designer might inadvertently remove the exact layer of context a decision-maker desperately needs. Simplicity is not the primary goal in itself; appropriate complexity is. Data is a message, and the right amount of signal depends entirely on who is receiving it. This leads to the core principle of data UX: roughly 80% of the work that determines whether a dashboard succeeds happens long before a single chart is ever drawn.
The 80% That Happens Before The Chart
This high-leverage 80% almost never happens on a screen. It happens upstream: before a software tool is opened, before a dataset is pulled, and before a single design choice is finalised. It comes down to three foundational questions, and once those inquiries become habitual, they fundamentally change what professionals notice, what they ask, and what they push back on at the outset of every new project.
Most data-heavy projects start entirely backward: teams pull whatever metrics their internal analytics tools already track and build visualisations around them, while the specific question the data was supposed to answer either gets assumed or ignored altogether. This happens simply because teams anchor on the data immediately in front of them as the absolute boundary of what is possible. Defining a goal first sounds obvious, but in practice, it rarely happens with the necessary clarity. Asking to show how a product is performing is not a goal; identifying which specific features drive user retention among customers who signed up in the first quarter is a goal, because it includes three essential elements the first lacks: a clear metric, a defined population, and an implied operational action. That exact specificity is what converts an open-ended exploration into a constrained, answerable design problem.

Audience analysis is equally critical, coming down to two core pillars: accountability and familiarity. Familiarity relates directly to data literacy. Do stakeholders read complex charts instinctively, or does an intricate visualisation create friction? Handing a dense, multi-layered dashboard to a Head of Sales and a senior data analyst is functionally identical to giving the same map to someone who navigates by landmarks and someone who reads exact grid coordinates. The data itself is accurate, but it is only functional for one of those profiles. Accountability dictates how that complexity must be presented. A chart showing a 12% decline carries vastly different psychological and professional weight for the corporate executive directly responsible for that performance versus the analyst simply tasked with reporting it. Understanding an audience means grasping this deep relationship, as data is never processed neutrally when professional performance is on the line.
Furthermore, most data projects operate on the comfortable assumption that if a chart is accurate and clear, the insight will naturally take care of itself. In reality, information and insight are entirely different states. Information is simply what the data shows, whereas insight is the specific decision, shift in understanding, or course correction someone makes as a result of seeing it. If the intended business change is not defined before the design process begins, a dashboard will inevitably default to passive reporting rather than driving proactive action.
From Questions To Dashboard: A Project Walk-through
These principles were put to the test during a project for a client-facing B2B SaaS platform focused on enterprise talent management and competency tracking. The platform captured a massive footprint of daily user telemetry, and the initial brief arrived open-ended: the company had an immense archive of user activity and needed to present it effectively to enterprise teams. While it would have been easy to chart everything captured, doing so would have resulted in a data graveyard. The responsibility extended far beyond pure interface craftsmanship; it required architecting a practical tool for real people who would open the dashboard routinely and expect an honest, immediate story about their workflows.

Translating the client’s broad ambition into tangible visualisations required defining the practical mechanics of performance. An obvious candidate for tracking was time spent by product—a metric every platform tracks, which is easy to show and feels intuitively meaningful. However, time spent is merely a proxy; it indicates presence, not whether a user actually gained anything from the experience. More meaningful signals included competency scores by area, certification completion rates, and historical performance trajectories. Integrating time-spent data alongside these performance metrics added a vital layer of interpretation, helping surface which modules users underutilized and whether that correlated with lagging scores.
Designing for distinct audiences required rejecting the lazy shortcut of using identical charts scaled differently for individuals and managers. Frontline team leads and individual contributors required entirely distinct narrative structures and design principles. The individual contributor workspace needed to act as a self-directed mirror that was granular, honest, and personal, helping users instantly understand their standing, strengths, and slipping metrics. Conversely, the manager’s interface had to bypass individual milestones initially to provide a macro pulse check on team vulnerabilities, prioritizing the aggregate picture while retaining an intuitive path to drill down into tactical day-to-day coordination.
To solve the core design problem of helping an individual user answer where their relative strengths and gaps lay across eight distinct competency areas at a single glance, the project utilised a radar chart. By organising multiple variables across axes radiating from a central point using polar coordinates, the interface connected data points to form a unified shape. While a traditional linear bar chart would have forced the viewer to scan eight individual bars and mentally calculate variance, a concentric, radial layout segmented data layers to make progress tracking and skill gaps immediately readable.

The shift from passive information to active insight manifested clearly in how the dashboard was utilised following deployment. Weekly active engagement on the platform’s analytics features rose noticeably, and managers stopped opening the tool once a month merely to pull static reports, using it instead every Monday morning to actively plan their teams’ weeks. Client-reported platform churn fell to some of the lowest points on record, and qualitative feedback indicated that visualisations allowed leadership to instantly spot slipping performance and schedule supportive catch-ups before small issues evolved into critical project failures. Data design ultimately reaches its full potential when visual presentation is treated as an upstream architectural choice rather than a downstream formatting step, ensuring every chart and metric serves a genuine human purpose.