











Traditional Python notebooks have long served as a staple for data exploration, yet they frequently present frustrating management hurdles. As analysts execute cells out of order, results quickly fall out of sync, leaving teams to grapple with fragmented workflows. Transforming a static notebook into an interactive application typically demands layering on additional tools or entirely rebuilding the analysis inside a separate framework.
Addressing these long-standing workflow bottlenecks, an open-source project called Marimo has introduced a cleaner, reactive paradigm for Python development. In a Marimo notebook, cells automatically execute and update whenever their underlying dependencies change. Furthermore, the entire project is stored as a standard Python file rather than a proprietary JSON-based structure, significantly simplifying version control with Git, reproducibility, and collaborative sharing.
To demonstrate this reactive workflow, developers frequently rely on a combination of Marimo, Pandas, and Altair to construct lightweight data analysis dashboards. By generating structured datasets, integrating native interactive controls, and visualizing the results directly within a browser-based editor, practitioners can seamlessly transition from exploratory data analysis to functional application deployment without leaving the Python ecosystem.


Installing and Initializing Marimo
Getting started with the framework requires a straightforward installation via standard package managers. Users can install Marimo alongside common data science libraries using terminal commands such as pip, uv, or Conda. The ecosystem also offers a recommended installation bundle that automatically packages essential data tools like DuckDB, Polars, and Altair, providing an immediate environment for analytical tasks.
Once installed, initializing a new workspace opens the Marimo editor directly within a web browser. Unlike traditional Jupyter environments that rely on the .ipynb file format, Marimo writes and reads code as a standard .py script. This design choice eliminates hidden notebook states and cell-execution anomalies, allowing developers to manage their codebases with the same discipline applied to standard software engineering projects.
Generating Analytical Datasets
To evaluate the capabilities of reactive notebooks, developers often construct realistic business datasets, such as sales records spanning multiple products, regions, and quarters. Using numerical generation libraries alongside Pandas, analysts can simulate metrics including units sold, unit pricing, and overall revenue across various geographic markets and product categories.
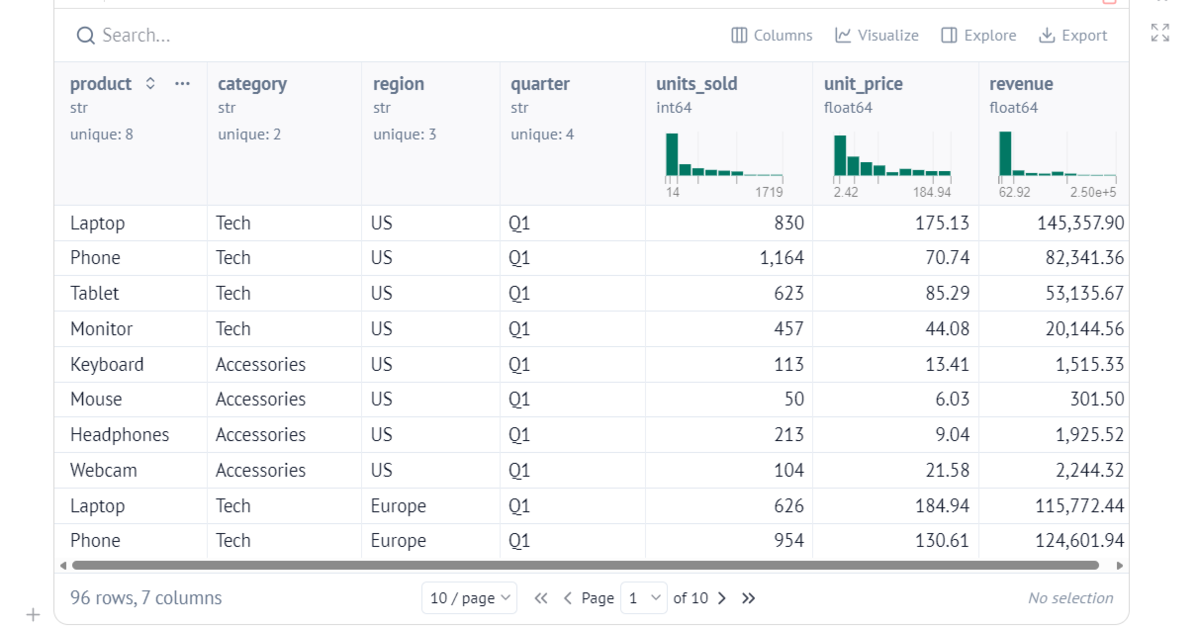
When working with dataframes in Marimo, users benefit from native display integrations. Simply placing a dataframe variable at the end of a cell instructs Marimo to render an interactive table automatically. Analysts can immediately search, sort, and filter through the dataset without writing auxiliary display code. This functionality extends across both Pandas and Polars, accommodating the varied workflow preferences of the data science community.
Integrating Native UI Controls
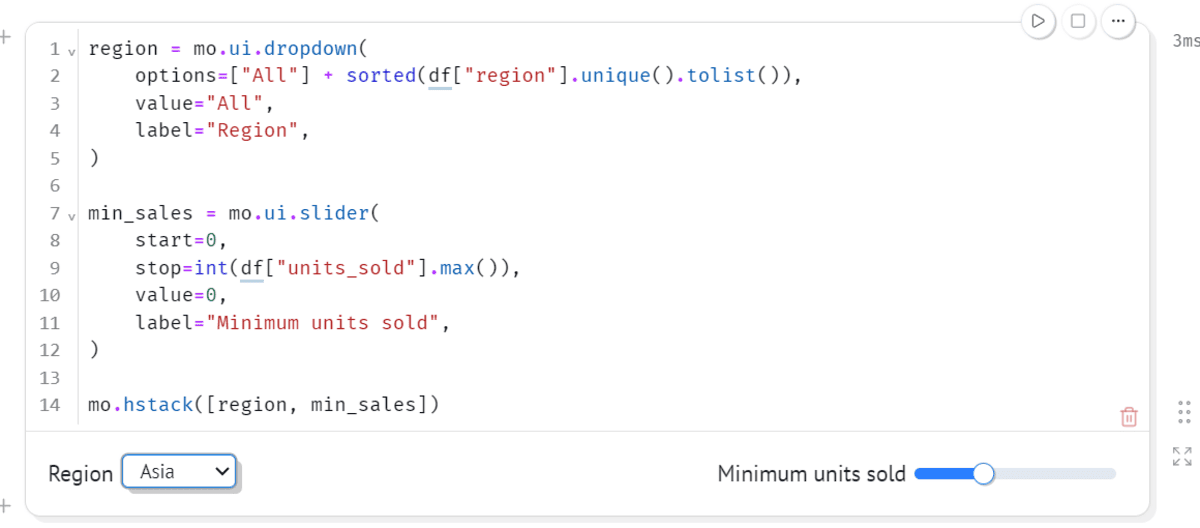
Interactive analysis typically requires dynamic user inputs, and Marimo addresses this by providing a comprehensive suite of built-in user interface components. Developers can incorporate dropdown menus, interactive sliders, checkboxes, date pickers, tables, file uploaders, and text inputs directly into their scripts with minimal syntax.
For instance, analysts can establish a regional dropdown menu combined with a numerical slider to govern minimum sales thresholds. Because these interface elements are native Python objects, they communicate fluidly with the rest of the script, establishing clear parameter boundaries for subsequent data manipulations and filtering logic.
Reactive Data Filtering
Once interface controls are established, connecting them to analytical dataframes highlights the core strength of reactive programming. As users adjust filter parameters—such as selecting a specific geographic region or modifying a sales slider—Marimo automatically identifies the downstream dependencies. The environment instantly recalculates the filtered dataframe without requiring manual intervention or explicit cell re-execution.
This reactive execution model fundamentally diverges from traditional notebook architectures, where users must manually trace dependencies and rerun cells sequentially to update outputs. By automating propagation, Marimo ensures that analytical results and visual representations remain synchronized with user inputs at all times.
Building Dynamic Visualizations
Connecting filtered datasets to visualization libraries allows developers to construct responsive graphical representations of their data. Marimo integrates smoothly with prominent Python visualization tools, including Matplotlib, Plotly, Altair, Seaborn, and HoloViews.
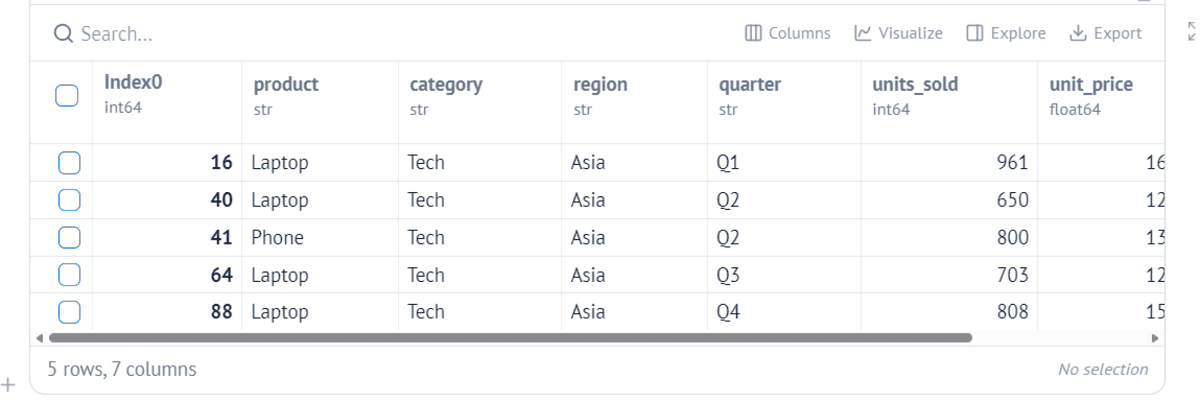
When an analyst modifies an interface control, the reactive framework updates both tabular data views and graphical charts simultaneously. Furthermore, advanced charting capabilities in libraries like Altair allow selections made within a chart to pass back into the Python session, unlocking highly responsive analytical workflows that rival dedicated dashboarding frameworks.
Deploying Notebooks as Interactive Applications
A prominent feature of the Marimo architecture is its dual-purpose execution model, allowing a single development file to function simultaneously as an exploratory notebook and a production-ready application. By launching the script in run mode via the terminal, users can deploy the notebook as a read-only web application that conceals the underlying Python code.
This capability bridges the historical gap between data exploration and application delivery. Analysts can utilize the exact same file for initial data investigation, iterative refinement, and stakeholder presentation, completely bypassing the need to rebuild or translate code into a separate web framework like Streamlit or Dash.

Reflections on the Reactive Workflow
Adopters of the framework frequently highlight the reduction in architectural complexity as a primary advantage. By consolidating code, user interface elements, and visualizations into a single Python file, practitioners eliminate the overhead associated with managing multi-file web projects or hosted notebook servers. Everything operates locally within the browser once initialized.
The adoption of standard Python file structures also simplifies collaboration. Code reviews through Git become straightforward text comparisons, avoiding the merge conflicts and bloated diff outputs common with traditional notebook formats. The polished out-of-the-box presentation of tables, sliders, and charts further enables developers to produce clean, professional deliverables without investing extensive time in frontend styling.
Ultimately, reactive notebook environments represent a streamlined pathway for turning exploratory Python scripts into interactive, presentable applications. By removing unnecessary infrastructure and unifying the development lifecycle, the tool offers a compelling alternative for data scientists seeking efficiency in modern analytical workflows.