






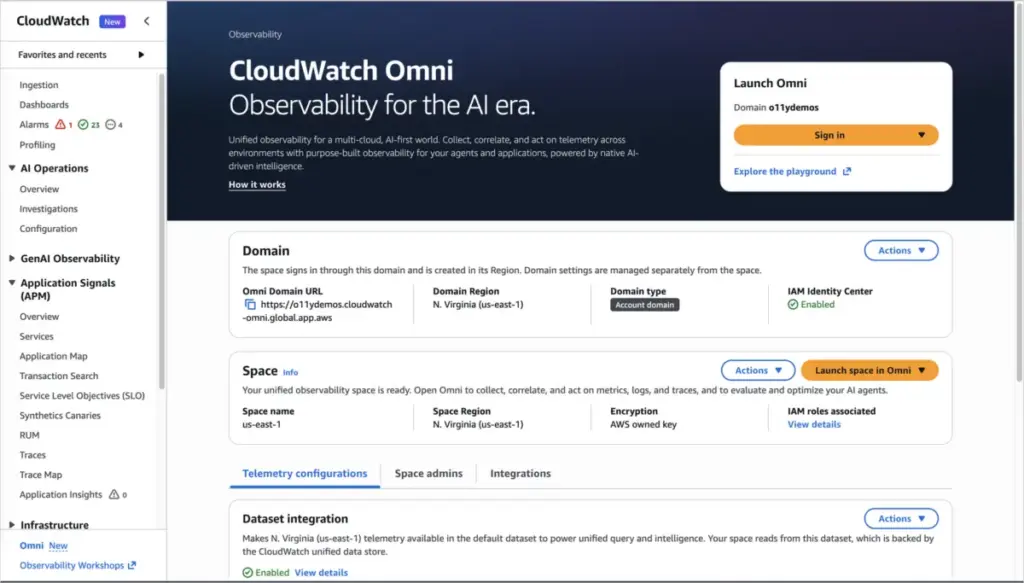
Amazon Web Services (AWS) has announced the launch of Amazon CloudWatch Omni, a significant evolution in its observability platform designed to unify the way engineering teams monitor applications and AI-driven workloads. By shifting the focus from fragmented infrastructure metrics to a holistic, application-centric view, CloudWatch Omni seeks to dismantle the silos that often hinder incident response and operational efficiency in modern, complex cloud environments.
The new offering addresses a pervasive challenge in the DevOps world: the "swivel-chair" effect, where engineers must constantly switch between disparate monitoring tools, analyze static dashboards, and hunt for context across disconnected communication channels like Slack threads. CloudWatch Omni mitigates this by providing a dedicated, collaborative workspace accessible via a single URL, independent of the AWS Management Console. This architectural shift allows SREs, developers, database engineers, and managers to operate from a shared "source of truth," ensuring that when incidents arise, the entire team is working with the same data, the same topology, and the same historical context.
A Unified Experience for Modern Engineering Teams
At the heart of CloudWatch Omni is a commitment to seamless integration. Built on OpenTelemetry, the platform ensures that existing telemetry data already flowing into CloudWatch is automatically available without the need for complex reconfigurations. For workloads not yet instrumented, Omni supports the OpenTelemetry Protocol (OTLP), providing a standardized way to ingest telemetry from diverse environments.
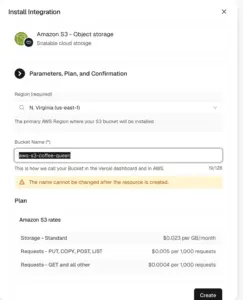
One of the most notable features of the platform is its approach to identity and access. By integrating with AWS IAM Identity Center, organizations can leverage their existing enterprise identity providers—such as Okta or Microsoft Entra ID—to manage user access. This removes the administrative burden of managing AWS Console credentials for every team member. Because Omni is accessed through a dedicated URL, it provides a tailored, lightweight experience that allows stakeholders to focus strictly on their operational responsibilities without needing to navigate the broader AWS management ecosystem.
Adapting to Dynamic Application Architectures
Modern software development is characterized by rapid deployment cycles and highly distributed microservices. In such environments, static dashboards frequently become obsolete as soon as they are created. CloudWatch Omni addresses this by treating observability as a dynamic, evolving capability rather than a static configuration. The platform automatically discovers services and maps their dependencies, creating a living topology of the application.
Instead of forcing teams to manually curate thousands of individual metrics or tweak alert thresholds that quickly drift out of alignment with production reality, Omni allows teams to declare their intent. By defining high-level objectives—such as availability targets, latency budgets, and acceptable error rate thresholds—the system automatically adapts. When a new service is deployed or a dependency changes, Omni updates the application map and adjusts monitoring parameters accordingly. This ensures that the observability layer grows and shifts in tandem with the underlying code, drastically reducing the "maintenance tax" typically associated with traditional monitoring tools.

AI-Driven Investigation with the Amazon DevOps Agent
Perhaps the most transformative aspect of CloudWatch Omni is the integration of the Amazon DevOps Agent. Designed to serve as a force multiplier for on-call engineers, the agent acts as an active participant in the incident response process. Unlike traditional automation that simply triggers alerts, the DevOps Agent participates in investigation sessions, correlating signals, analyzing logs, and suggesting potential paths forward based on the real-time state of the application.
When an incident occurs—such as a spike in error rates within a checkout service—the agent does not merely report that something is wrong. It immediately presents the team with a pre-loaded investigation session. This session might include the relevant service topology, a visual correlation of a recent deployment, and latency data from downstream APIs. By grounding its analysis in the same telemetry that the engineers are viewing, the agent provides actionable insights rather than speculative data. It can trace root cause paths through the dependency graph and maintain a comprehensive history of the investigation, which serves as a valuable resource for post-incident reviews and knowledge sharing.
The Anatomy of an Incident Workflow
To illustrate the practical impact of this new observability paradigm, consider a typical failure scenario. Suppose an alarm fires, indicating elevated error rates in a mission-critical checkout service. Under previous monitoring models, an engineer might spend valuable minutes opening multiple browser tabs, searching for recent deployments, and asking teammates if they changed any upstream configurations.
With CloudWatch Omni, the process is streamlined from the outset. The platform opens an investigation session that is already populated with critical context. The on-call SRE can immediately see that a deployment occurred 10 minutes prior to the spike. They can then observe a correlated latency increase in a downstream payment API. Recognizing that the issue lies outside their direct service, the SRE escalates the matter to the payments team. Because the investigation session is collaborative and persistent, the engineer from the payments team joins the same session and sees exactly what the SRE has already discovered, including the DevOps Agent’s analysis. The agent may have already identified a configuration change in the payment provider’s API gateway as a potential root cause. With the context shared, the team can verify the issue and initiate a rollback within minutes, while the entire investigation history is captured automatically for future reference.
Deployment and Integration
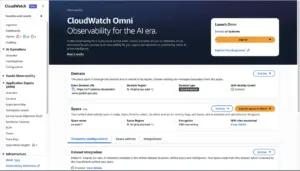
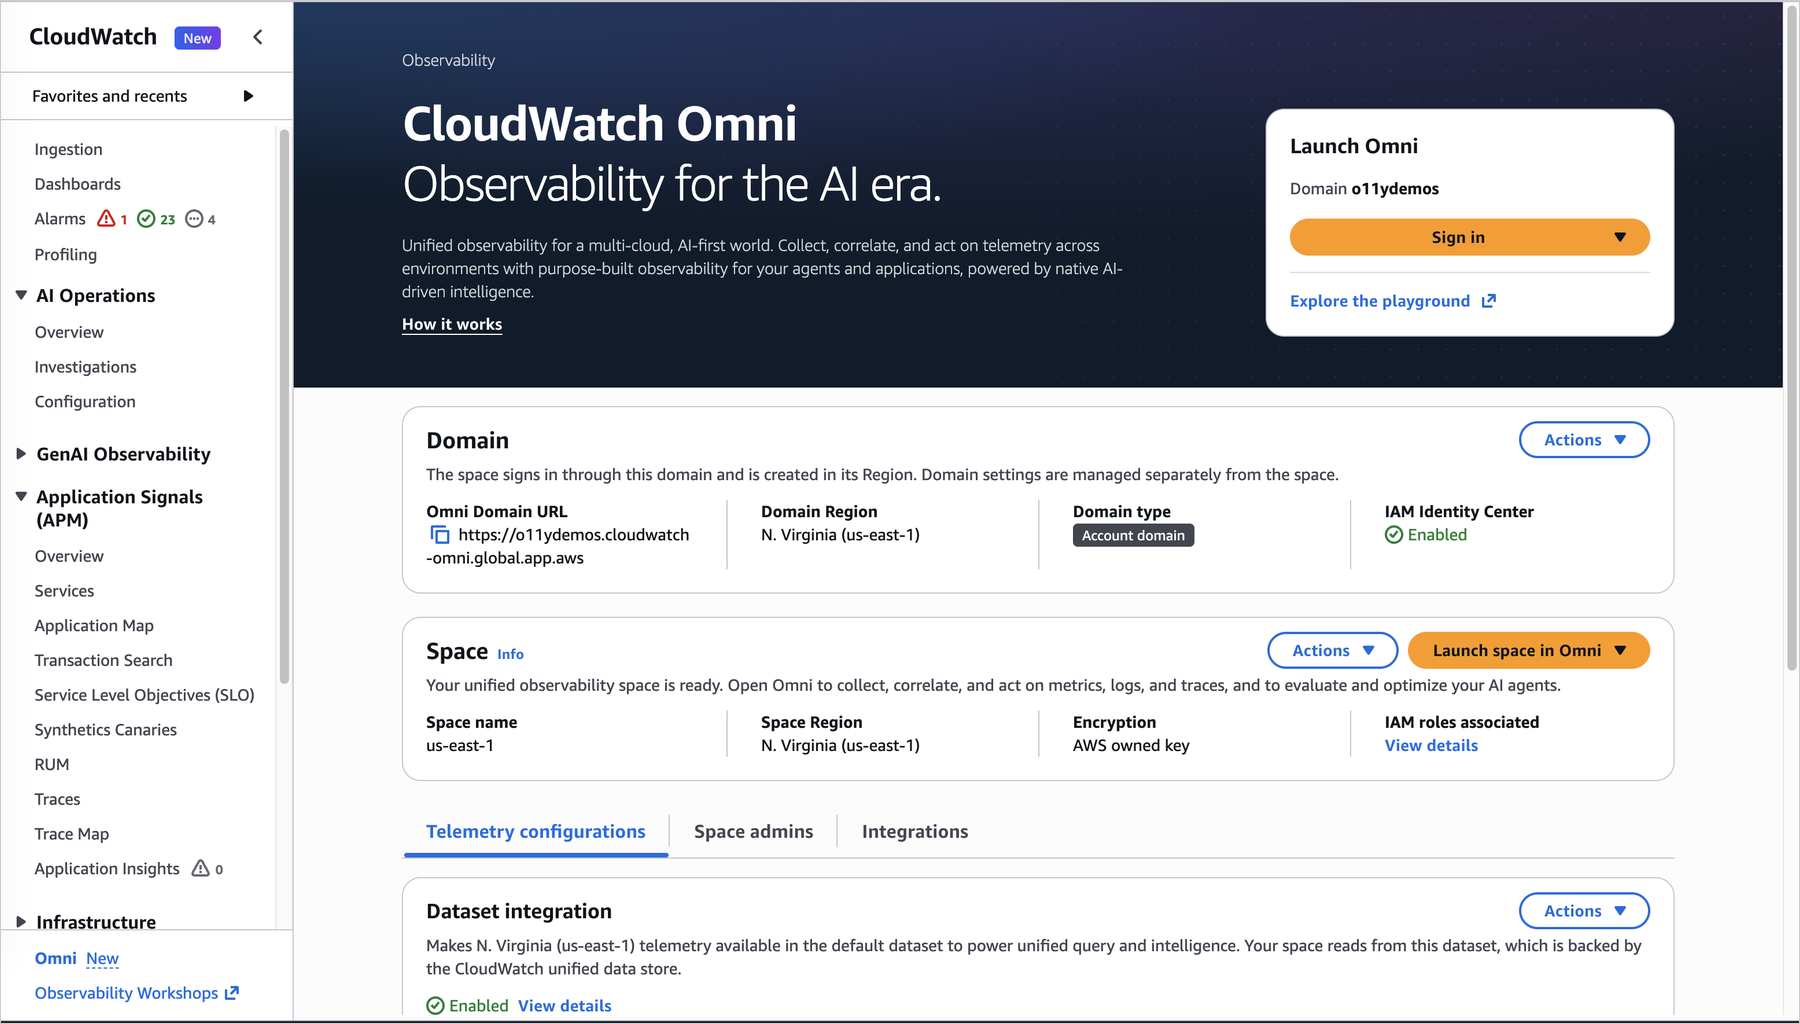
Getting started with CloudWatch Omni is designed to be an accessible process for existing AWS customers. Within the CloudWatch console, users can trigger the setup process, which initiates the discovery of existing logs, metrics, traces, and alarms. For organization-wide deployments, an administrator simply needs to define a domain, configure the identity provider, and establish "Spaces."
A Space serves as the primary container for a team’s observability experience. It groups relevant applications and associated telemetry, providing a focused environment where team members can monitor their specific responsibilities. Because these Spaces point directly to existing CloudWatch data, there is no need to move data or pay for redundant storage.
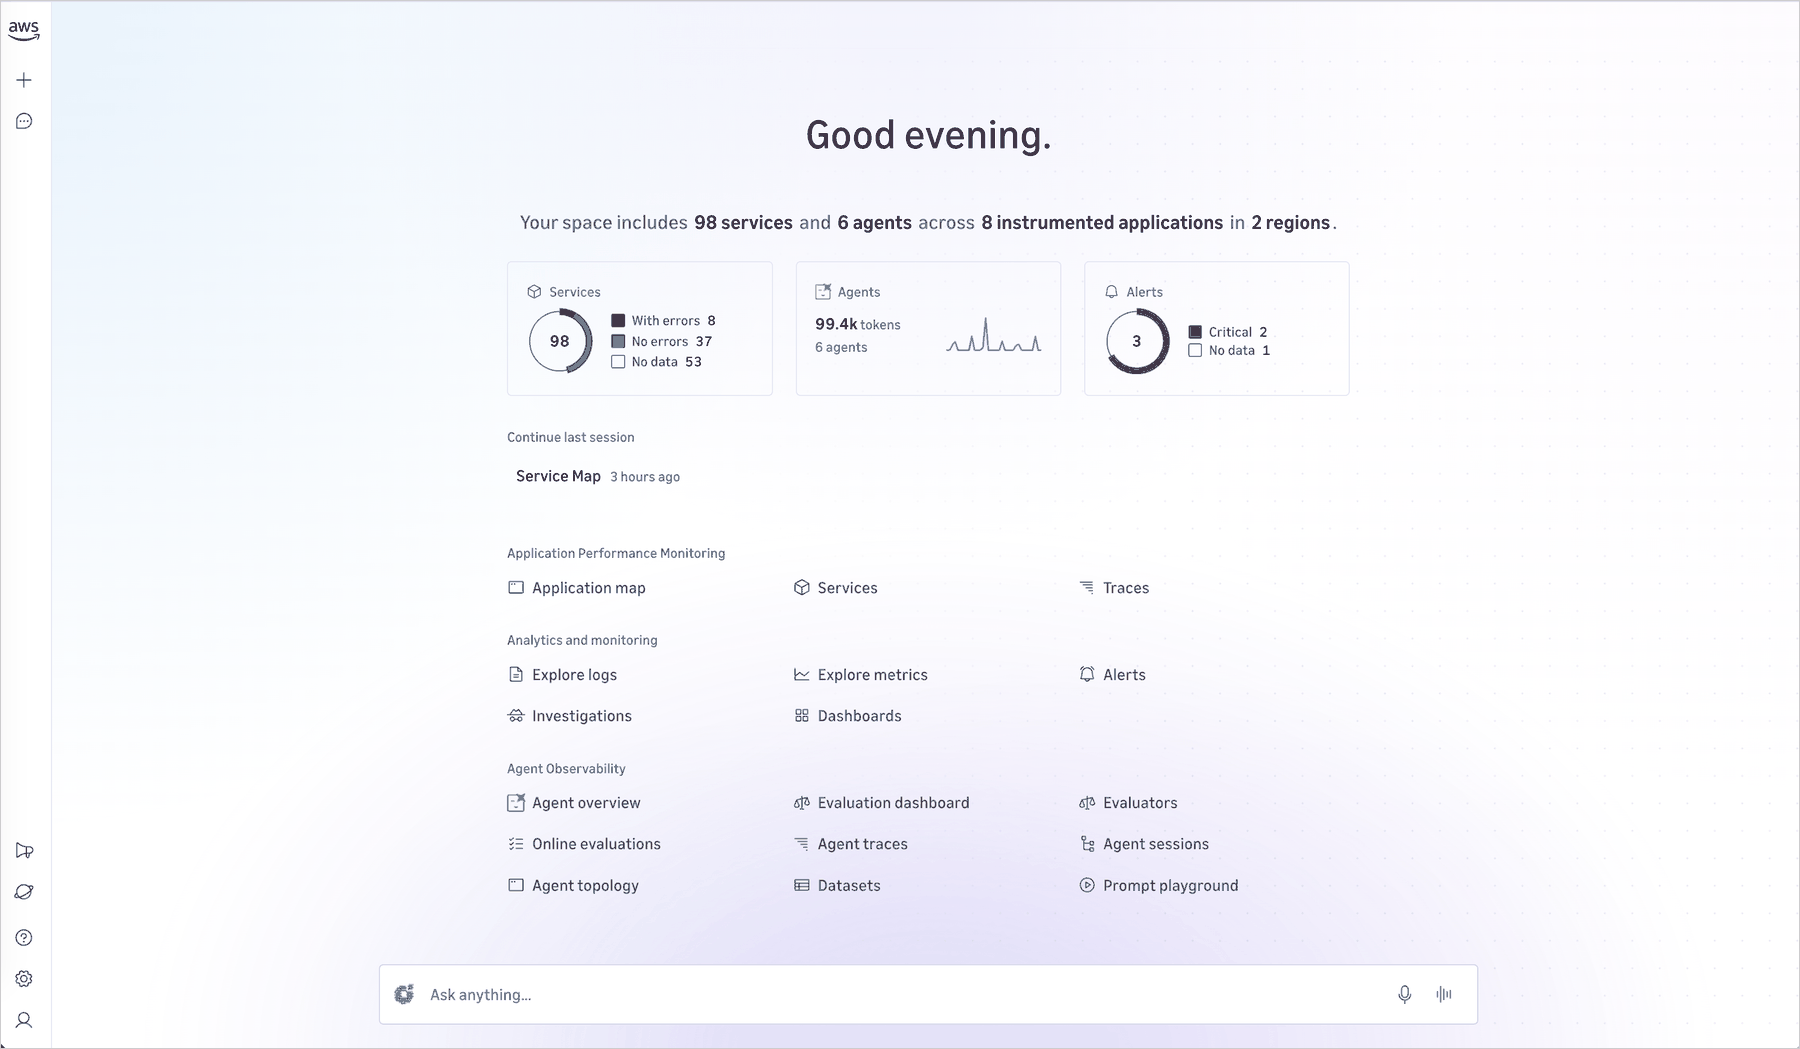
Beyond AWS-native workloads, the platform is designed to be inclusive. Through various connectors, teams can ingest telemetry from external environments, ensuring that all application signals appear alongside AWS data in a single interface. This is particularly relevant for modern AI and agentic workloads, which often require specialized observability frameworks. As noted by AWS, the same infrastructure that supports standard application monitoring also provides purpose-built features for AI agents, including trace exploration and evaluation frameworks.
A New Standard for Operational Efficiency
The introduction of CloudWatch Omni reflects a broader industry shift toward observability that prioritizes human collaboration and intelligent automation. By moving away from infrastructure-centric monitoring toward an application-first approach, AWS is aiming to reduce the cognitive load on engineering teams, allowing them to spend less time managing the "how" of monitoring and more time optimizing the "what" of their services.
The platform is available now for all existing CloudWatch customers. As organizations continue to scale their reliance on distributed microservices and generative AI, the ability to maintain visibility without succumbing to the overhead of complex, manual tool management will likely become a competitive necessity. For those looking to dive deeper into the technical capabilities or the specific agent-based observability features, AWS has provided comprehensive documentation and support channels, including the AWS MCP Server, to help teams integrate these new capabilities into their existing development workflows. Through this evolution, CloudWatch is positioning itself not just as a repository for metrics, but as an active partner in the engineering lifecycle.