










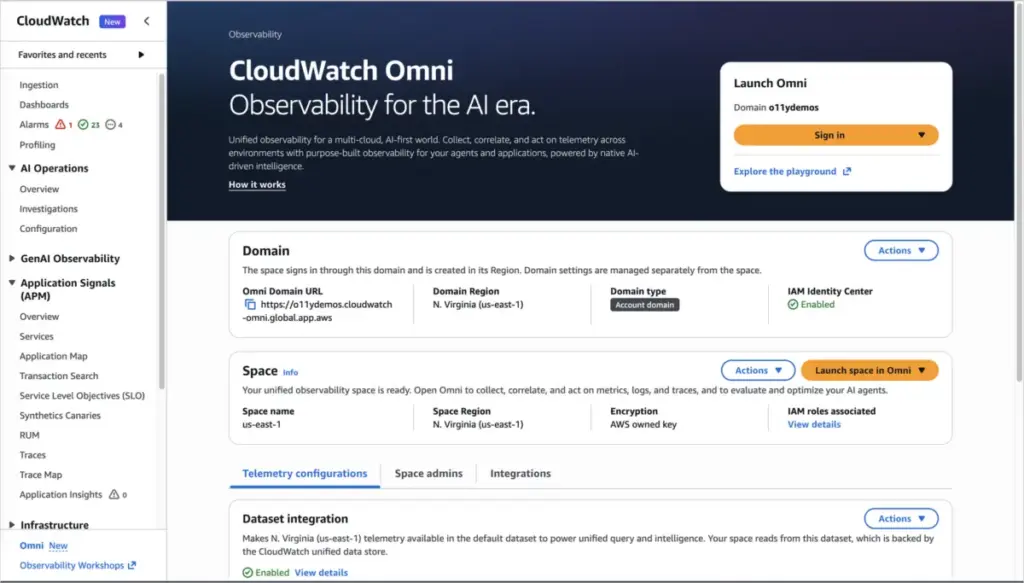
In a significant move to streamline how engineering teams monitor, diagnose, and resolve issues within complex software environments, Amazon Web Services (AWS) has announced the launch of Amazon CloudWatch Omni. This new AI-powered observability platform is designed to unify the monitoring experience for both traditional applications and the rapidly growing class of generative AI and agentic workloads. By shifting the focus from fragmented infrastructure metrics to a holistic, application-centric view, CloudWatch Omni aims to dismantle the silos that often hinder rapid incident response in modern engineering organizations.
For many years, observability has been a high-friction task. Engineering teams have traditionally spent a disproportionate amount of their time building and maintaining bespoke dashboards, manually tuning alert thresholds, and toggling between a suite of disparate tools to reconstruct the timeline of an incident. When an issue spans multiple microservices or team boundaries, critical context is frequently lost, relegated to transient Slack threads or isolated screenshots. This fragmentation not only delays resolution times but also increases the cognitive load on developers and Site Reliability Engineers (SREs). CloudWatch Omni is designed to address these systemic inefficiencies by centralizing telemetry and providing a unified collaborative workspace for cross-functional teams.
A Unified Collaborative Workspace
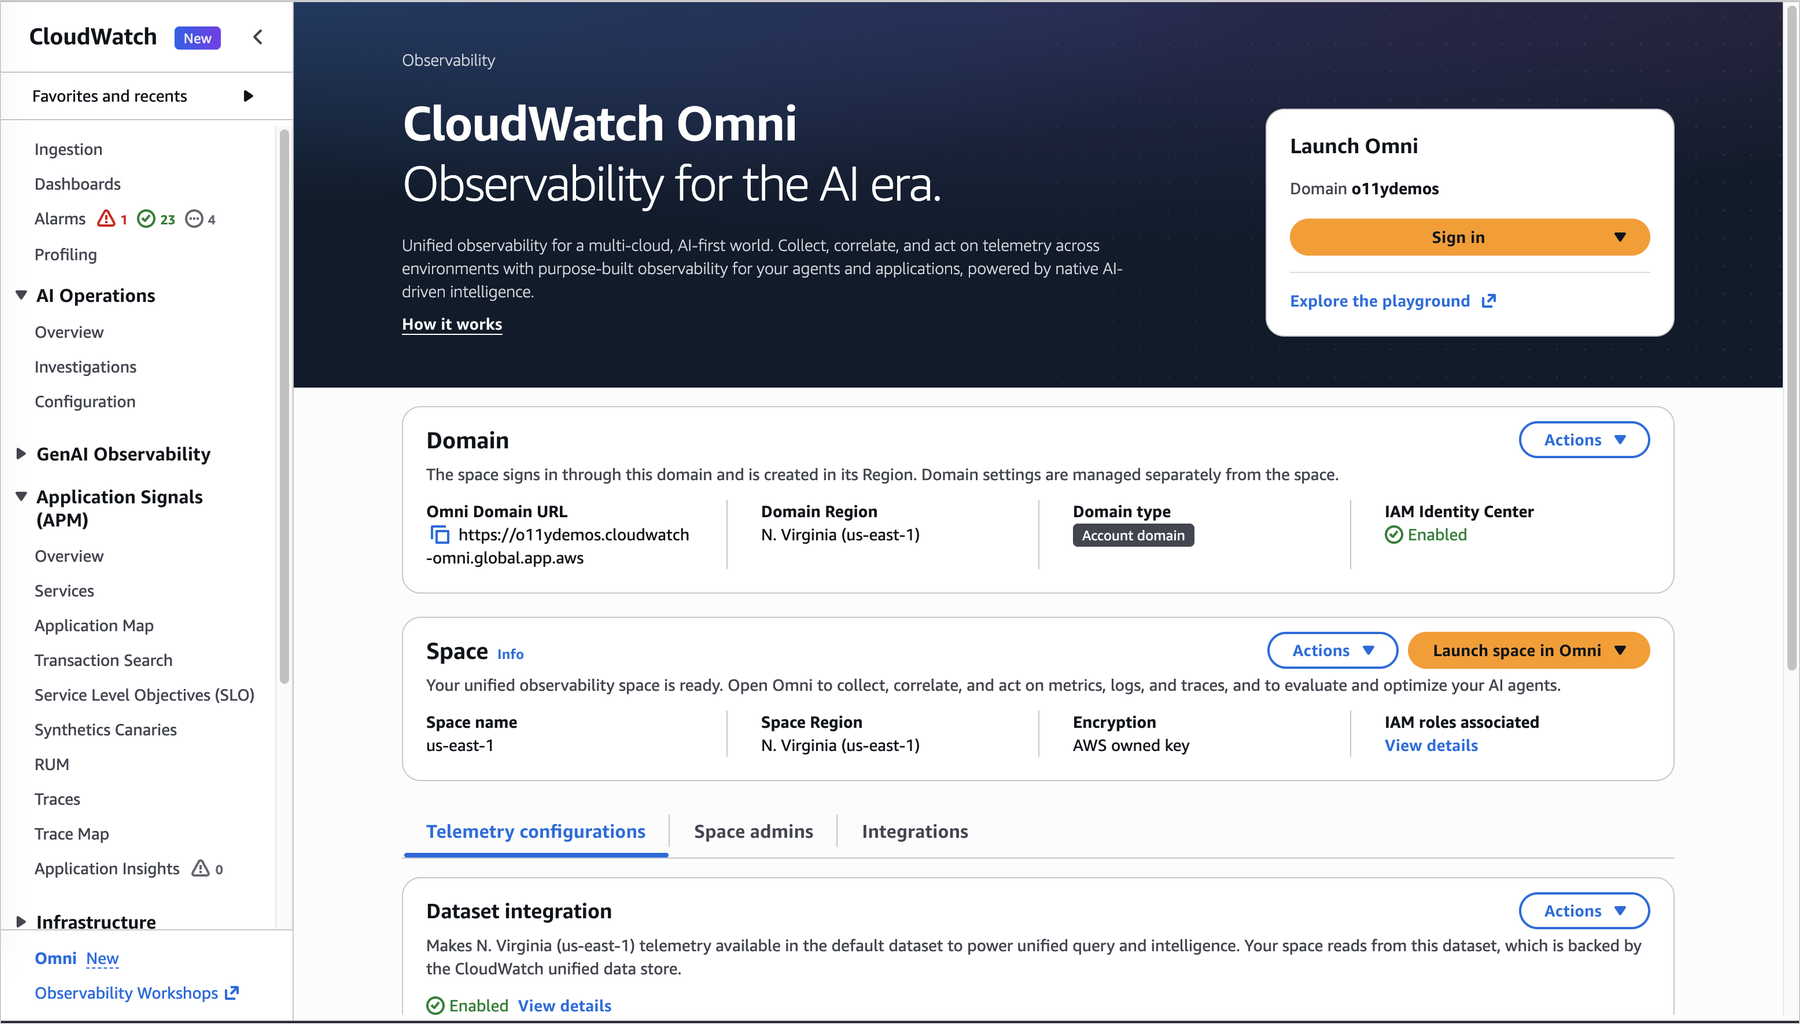
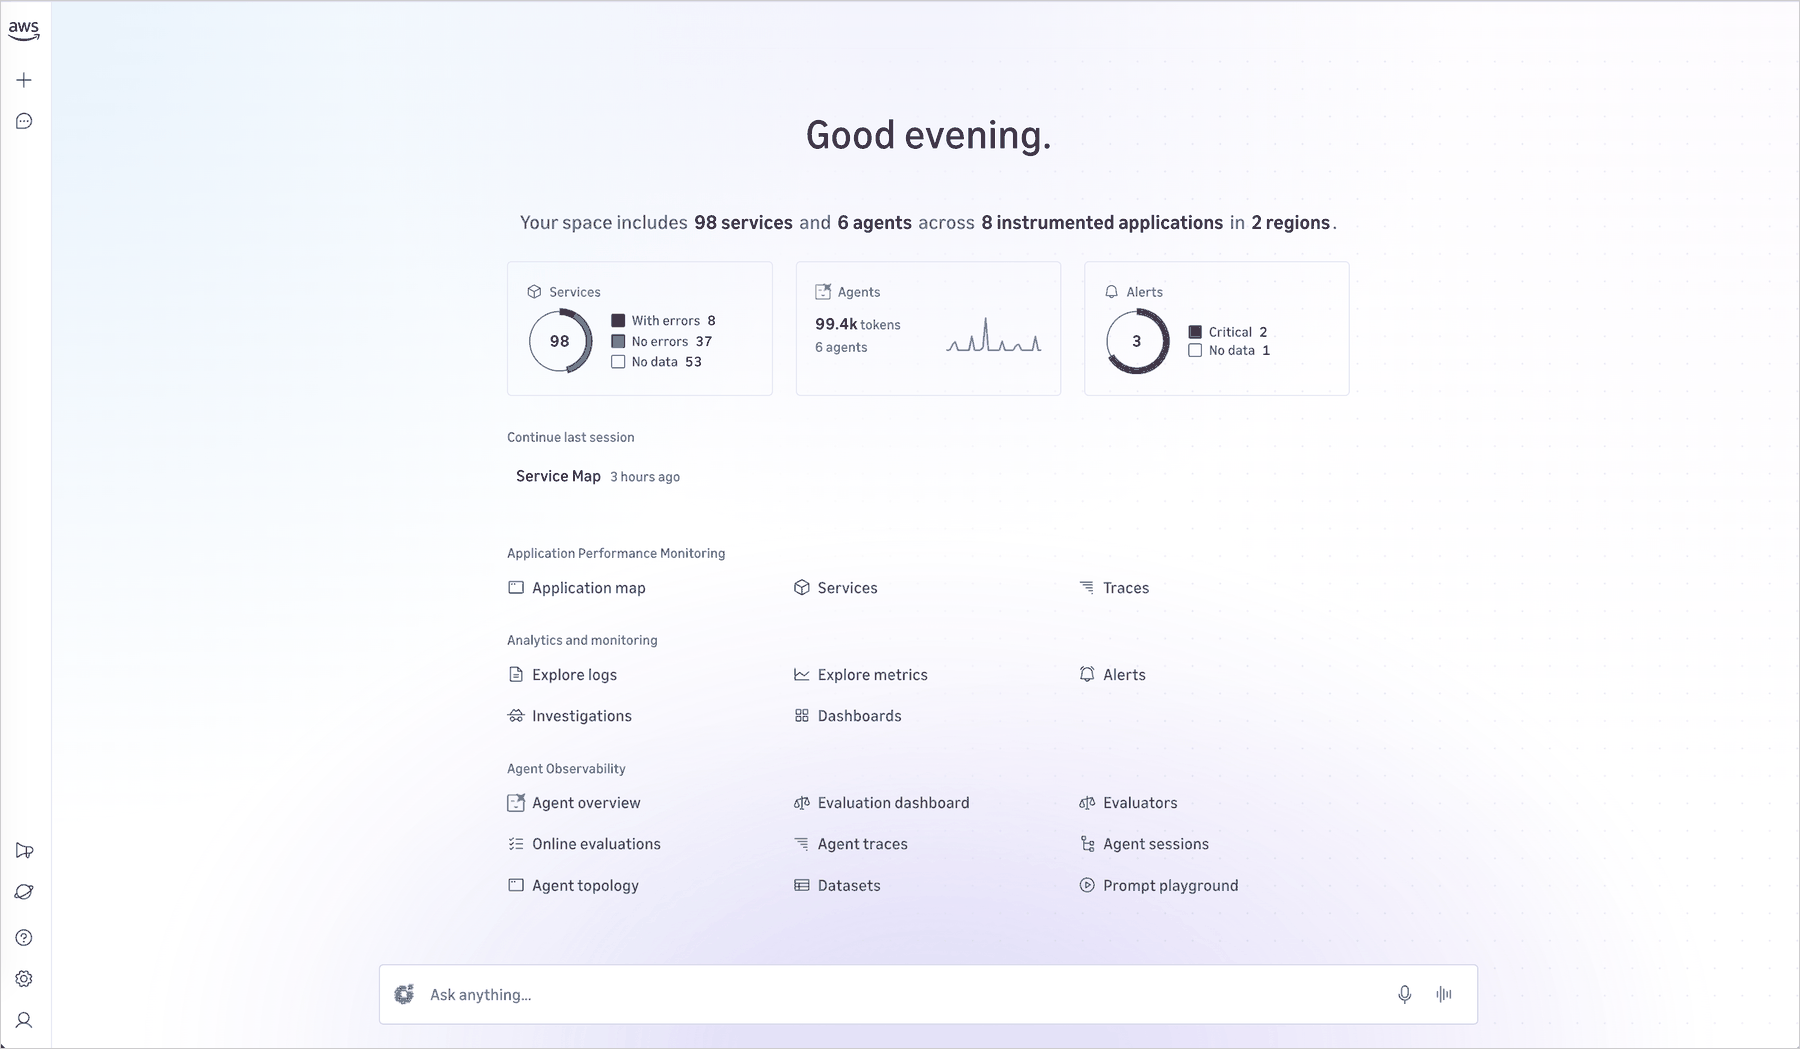
The core philosophy behind CloudWatch Omni is to treat observability as a team sport. Accessing the platform is straightforward; teams reach Omni through a dedicated URL, integrating seamlessly with existing enterprise identity providers such as Okta, Azure AD, or other SAML 2.0-compliant systems via AWS IAM Identity Center. By decoupling the observability workspace from the broader AWS Management Console, organizations can provide SREs, developers, database engineers, and managers with a secure, shared environment. This access model ensures that when an investigation is escalated, a new team member can join an existing session with the full context of the incident already visible, eliminating the need for tedious handoffs or manual information sharing.
The platform is built on the foundation of OpenTelemetry, ensuring that organizations can leverage the telemetry data they are already collecting. There is no requirement to reconfigure existing instrumentation; data already flowing to CloudWatch appears in Omni automatically. Furthermore, any additional workloads instrumented with OpenTelemetry can transmit data directly to an OpenTelemetry Protocol (OTLP) endpoint, making Omni an extensible hub for heterogeneous application environments.

Adapting to the Evolution of Modern Systems
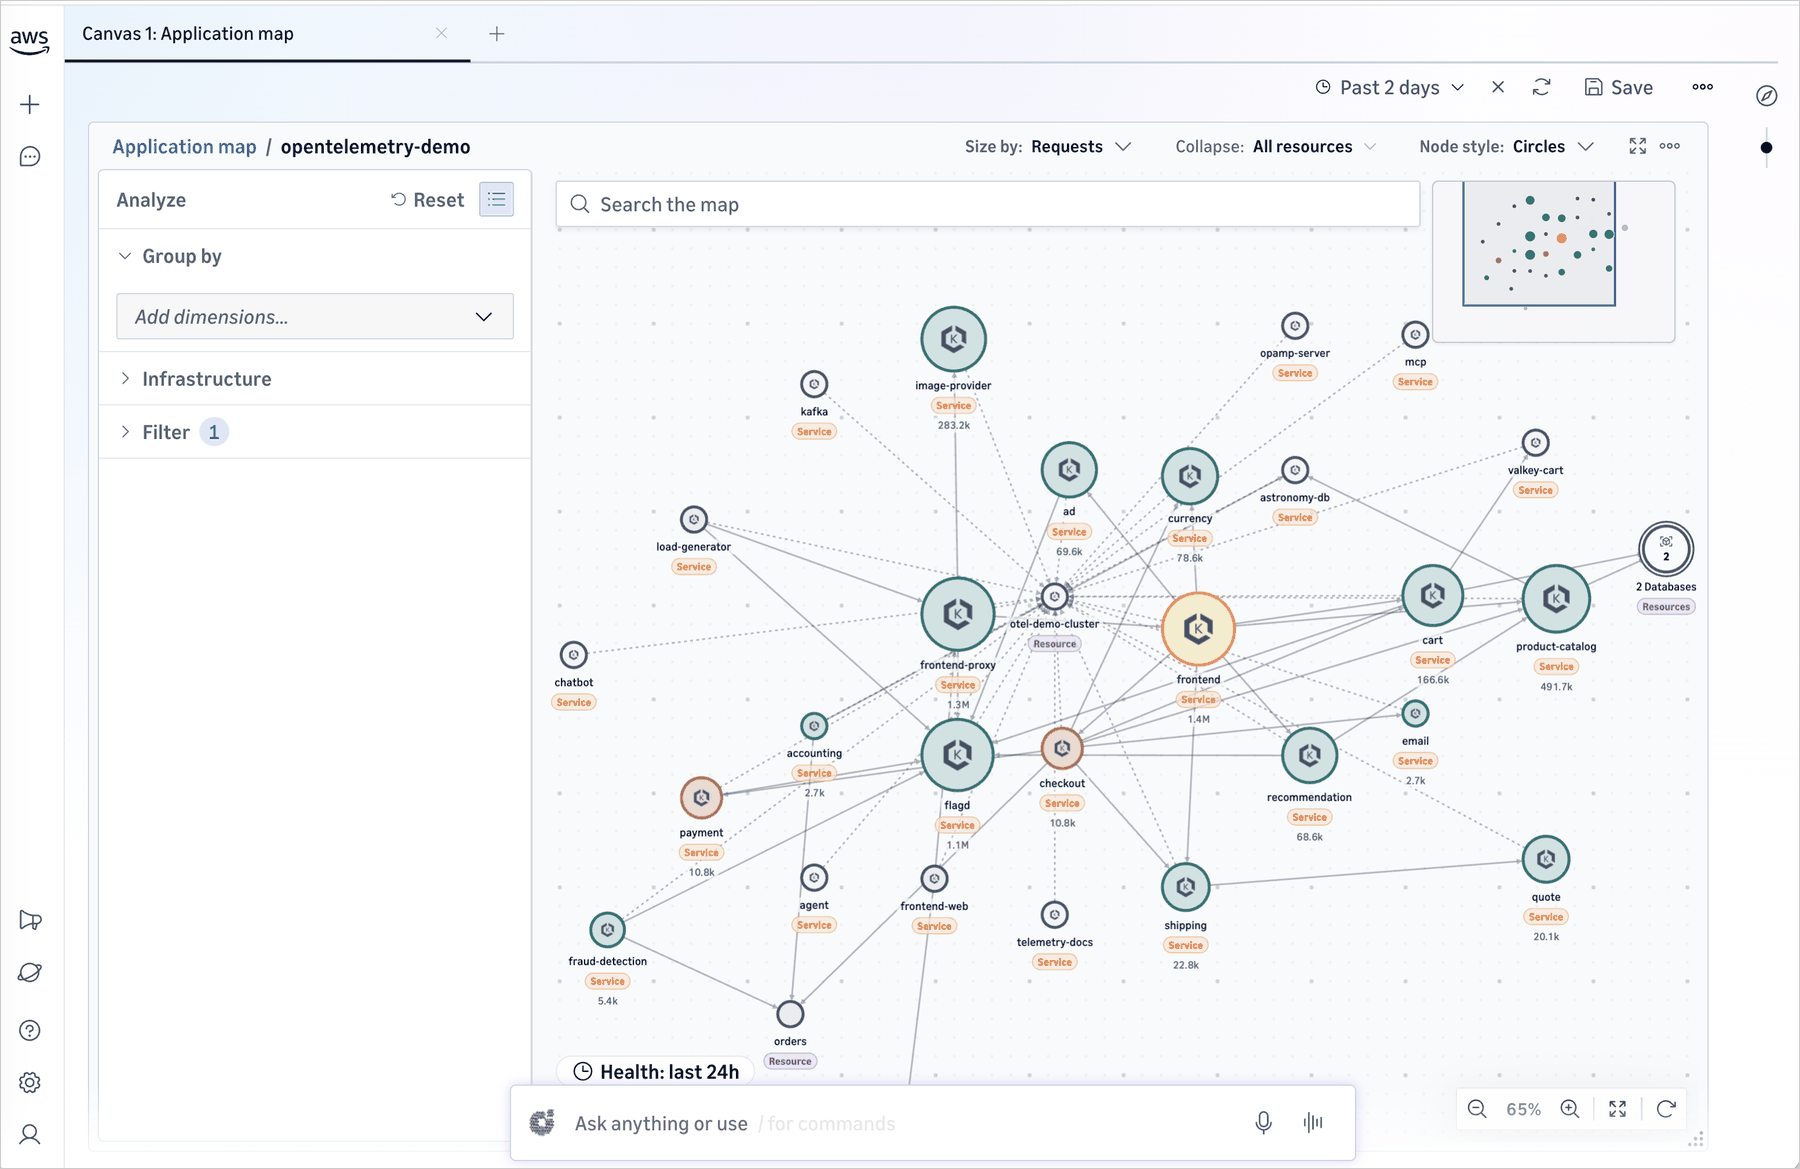
Modern applications are dynamic, characterized by frequent deployments and shifting dependencies. Traditional static dashboards often struggle to keep pace with these changes, requiring constant manual intervention to update thresholds or track new services. CloudWatch Omni approaches this challenge through automated discovery and mapping. Instead of forcing teams to curate static views, the system dynamically identifies services, maps their dependencies, and adjusts alarms based on defined targets.
Teams are empowered to declare their operational requirements—such as availability targets, latency budgets, and error rate thresholds—rather than micro-managing the underlying metrics. As the underlying system architecture evolves and new services are deployed, the application topology within Omni updates automatically. This shift from infrastructure-focused monitoring to application-centric observability allows teams to visualize their software as a connected system, rather than a loose collection of isolated cloud resources.
AI-Powered Investigation with the Amazon DevOps Agent
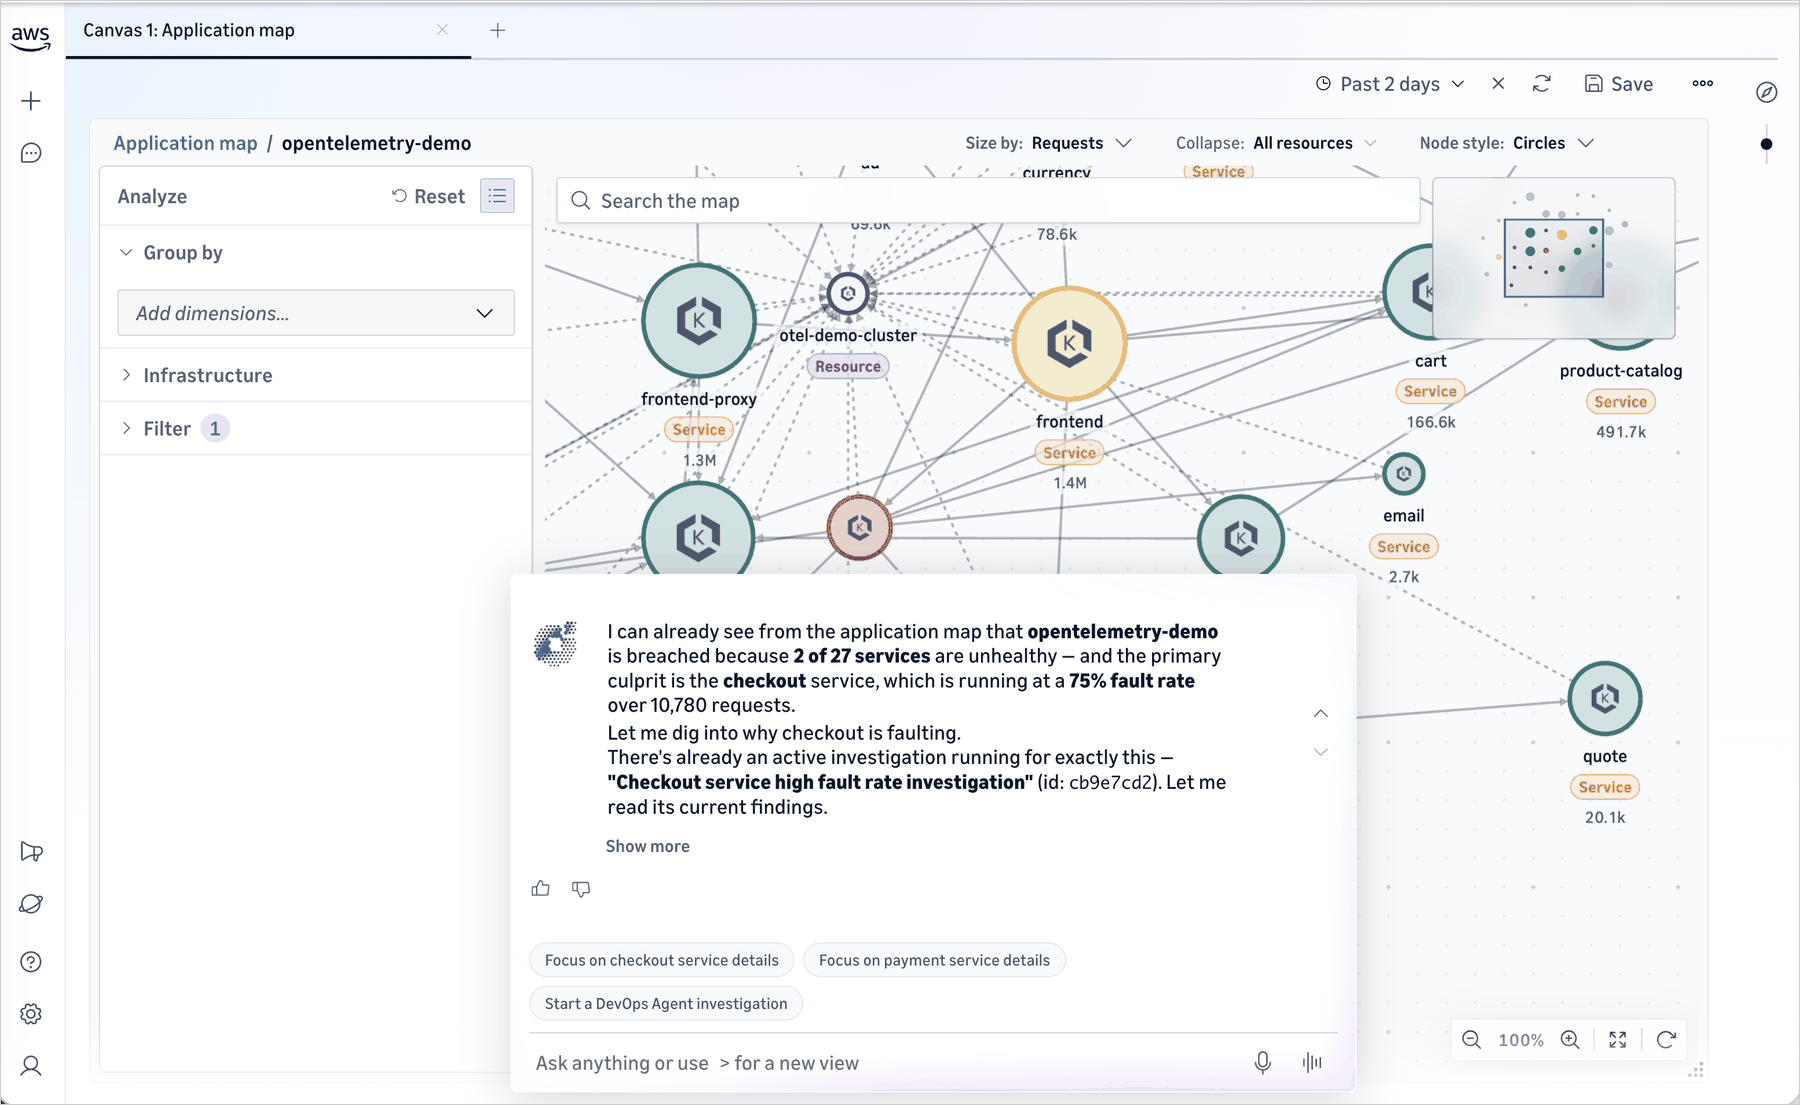
Perhaps the most transformative aspect of the new offering is the integration of the Amazon DevOps Agent. This AI-powered assistant functions as a collaborator within the investigation session, actively working alongside human engineers. By analyzing the same telemetry data that the engineers are observing, the agent provides a grounded, context-aware analysis of incidents. It excels at correlating signals across services, identifying root cause paths within complex dependency graphs, and providing suggested next steps for remediation.
Consider a typical incident scenario: an alarm fires regarding elevated error rates in a checkout service. Within CloudWatch Omni, an investigation session is automatically initialized with the relevant context. The dashboard immediately displays the service topology, highlights correlated signals—such as a recent deployment ten minutes prior or increased latency in a downstream payment API—and provides the DevOps Agent’s preliminary analysis.
In this workflow, an on-call SRE can quickly verify the correlation between the deployment and the error spike. By pulling in the trace view, the engineer can pinpoint the exact failing endpoints. If the issue is escalated to the payments team, the responding engineer joins the same session, instantly accessing the history of the investigation, including the agent’s correlation with a configuration change in a third-party API gateway. Because the platform automatically captures the entire investigation history, the need for manual post-incident reports is significantly reduced, allowing teams to focus on resolution and long-term architectural improvements.
Streamlined Setup and Broad Applicability
Getting started with CloudWatch Omni is designed to be a frictionless experience. For existing CloudWatch customers, the transition requires minimal effort; a user simply selects the "Try CloudWatch Omni" option within the CloudWatch console. Because the platform references existing logs, metrics, traces, and alarms without requiring data movement, the setup is nearly instantaneous. Once the initial configuration is complete, administrators can define "Spaces"—logical groupings that represent the applications owned by specific teams—ensuring that relevant telemetry is presented to the right people.
For organizations operating in hybrid or multi-cloud environments, CloudWatch Omni offers connectors that allow for the ingestion of telemetry from external sources. This ensures that even applications residing outside of the AWS ecosystem can be monitored alongside native AWS workloads within the same unified space.
This flexibility extends to the emerging field of generative AI and agentic workloads. Recognizing the unique challenges posed by LLM-powered applications, the platform includes purpose-built observability features such as advanced trace exploration, evaluation frameworks, and real-time monitoring of AI agents. By offering a unified experience that bridges the gap between traditional software components and complex AI agents, AWS is positioning CloudWatch Omni as a comprehensive solution for the modern, AI-augmented development lifecycle.
The platform is available now, and AWS encourages customers to explore its capabilities by visiting the CloudWatch console. For those looking to integrate Omni into broader automation workflows, AWS also provides the AWS MCP Server and various plugins, enabling developers to interact with the service through their preferred AI tools, documentation browsers, and API clients. As organizations continue to scale their reliance on complex, distributed systems and intelligent agents, tools like CloudWatch Omni represent a necessary evolution in how teams maintain the reliability and performance of their digital infrastructure. By prioritizing collaboration, automation, and AI-driven insights, AWS is setting a new standard for what it means to observe and manage the software that powers the modern enterprise.