









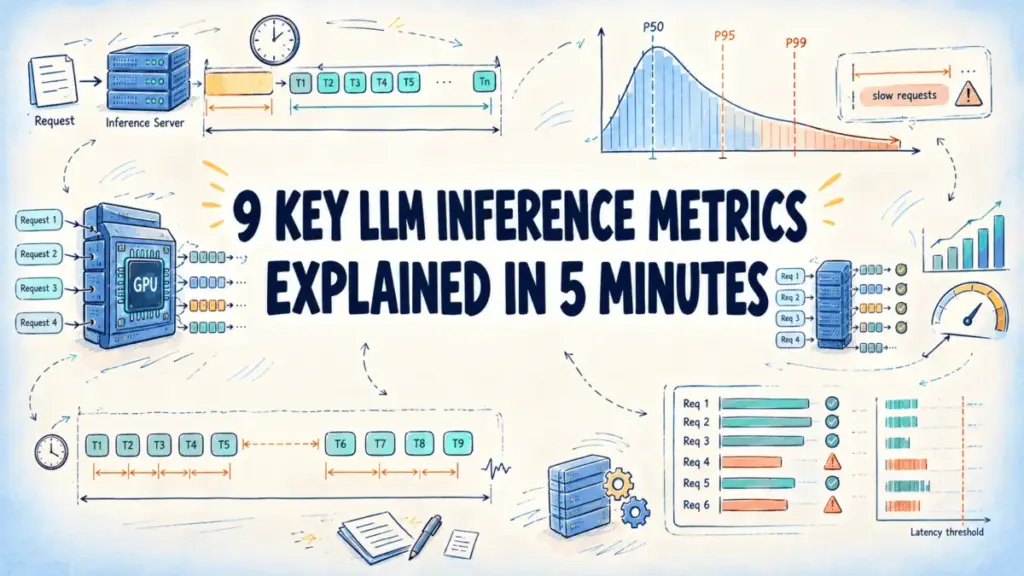
In the rapidly evolving landscape of generative artificial intelligence, developers and system architects frequently look to token throughput as the ultimate yardstick for large language model performance. However, industry experts caution that a high volume of processed tokens does not necessarily translate to a fluid, responsive user experience. While raw throughput measures the sheer volume of data a system can churn through, it fundamentally obscures critical nuances in application responsiveness. A user might experience frustrating delays if the initial response takes too long to materialize, or if subsequent tokens stream at an agonizingly sluggish pace—particularly under heavy concurrent system loads.
To bridge this gap in performance evaluation, engineers rely on a comprehensive suite of inference metrics. These analytical tools break down system efficiency into measurable components, tracking everything from initial response delays to token generation speeds and overall server capacity. By examining the precise timeline of a single request, developers can evaluate latency, pinpoint operational bottlenecks, and track system performance over time. Understanding these underlying mechanics is becoming increasingly vital as organizations scale their AI deployments to meet enterprise demands.
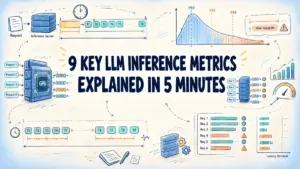
Analyzing a request’s lifecycle begins with mapping its timeline using several key timestamp values. These include the exact moment a request leaves the client, the arrival time of the first generated output token, and the arrival time of the final output token, alongside the total count of generated tokens. By charting these timestamps, engineers can segment a request into distinct operational phases. Before the first token arrives, a request typically sits in a server queue before the system executes the prefill phase—a process where the model ingests the prompt and computes the initial response token. Once that first token is produced, the server enters the decoding phase, emitting subsequent tokens sequentially, usually one step at a time. Every latency metric evaluates either one of these distinct segments or the aggregate span of the entire request lifecycle.

The primary set of metrics focuses heavily on latency, describing how long an end-user must wait for a response, both on an individual request basis and across aggregate traffic. The time to first token measures the precise delay between sending a request and receiving that initial output token. Because this metric encompasses network travel time, queue waiting periods, and prompt processing, it tends to grow organically as server loads and prompt lengths increase. Interactive chat applications monitor this specific metric with intense scrutiny, as it dictates the duration a user stares at a blank screen before seeing any system activity.
Beyond the initial delay, end-to-end latency captures the total duration of the wait, spanning from the initial request transmission to the delivery of the final token. This metric essentially represents the sum of the initial token wait and the subsequent streaming duration. Token generation time specifically isolates that streaming segment, quantifying how long the server takes to deliver every token that follows the initial response. Because token generation time naturally expands alongside the length of the output, engineers rely on time per output token to normalize and judge the actual speed of the stream.
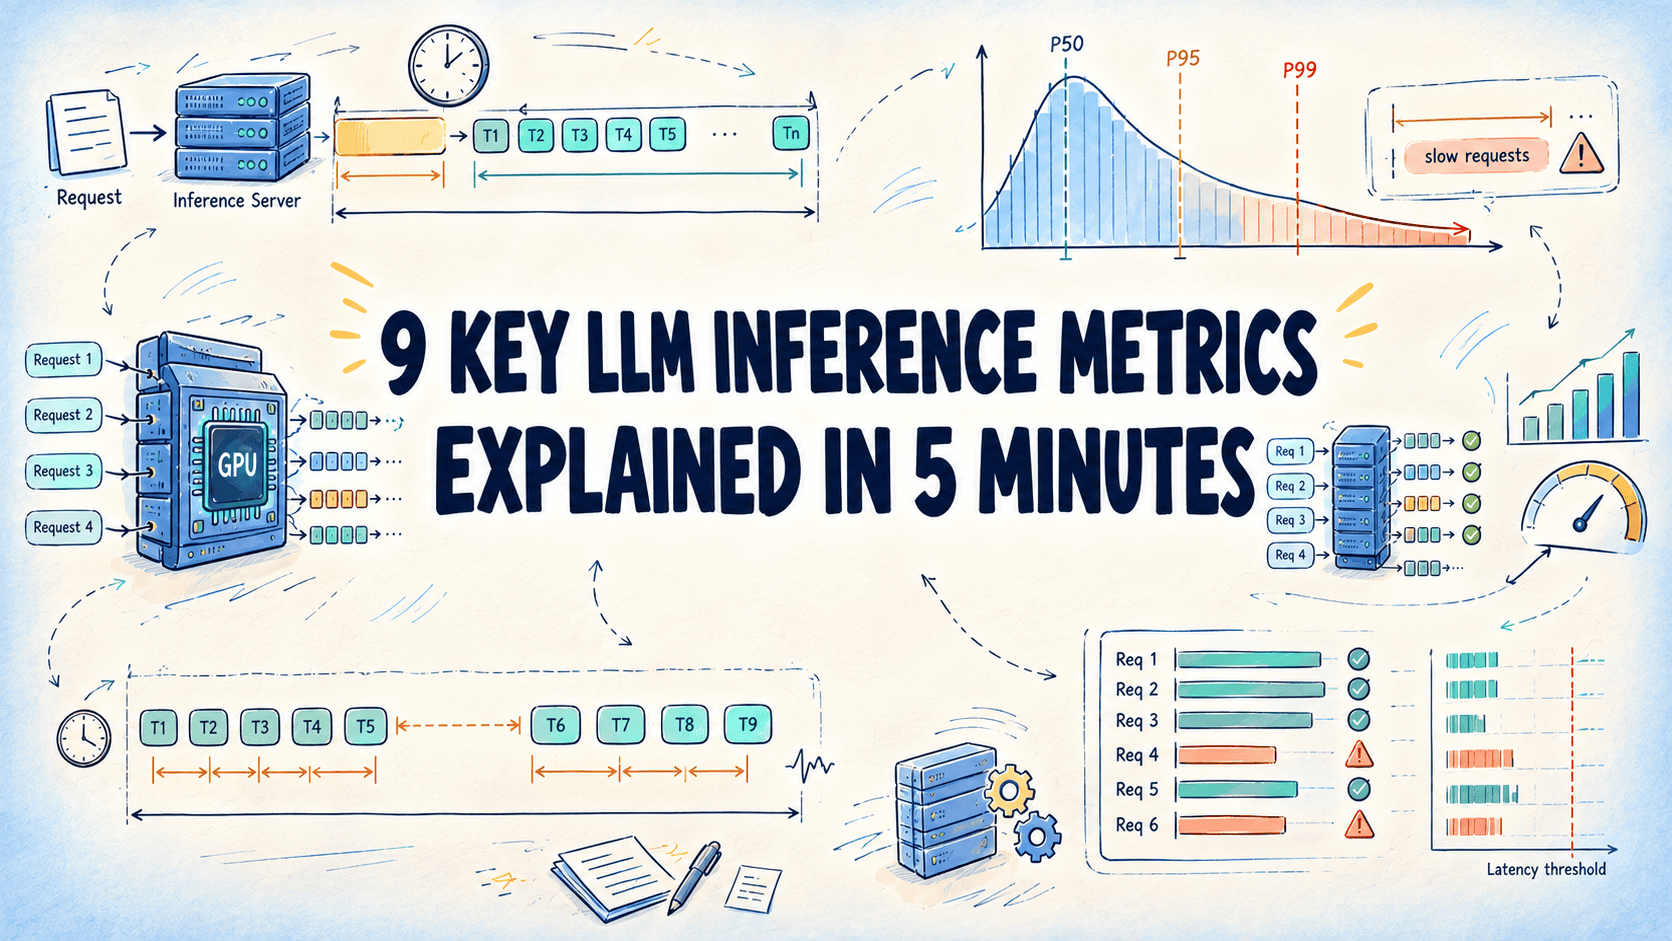
Time per output token calculates the average duration between consecutive output tokens after the first one has been delivered, effectively distributing the total generation time evenly across the remaining tokens. Because the first token is already accounted for in the initial delay metric, the mathematical calculation adjusts accordingly, rendering the metric inapplicable for single-token replies. Industry benchmarking tools sometimes diverge on minor computational details, with some incorporating the initial delay into the average or utilizing alternate terminology for inter-token gaps, prompting engineers to verify definitions before drawing cross-platform comparisons.
Inter-token latency further refines this analysis by measuring the precise gap between two consecutive output tokens. While a single request generates multiple individual gaps, calculating the mean across numerous requests reveals important operational insights. Analysts note that examining these individual gaps is often where minor stalls or hiccups in the token stream become visibly apparent. Furthermore, because latency naturally fluctuates across different requests, calculating simple averages is rarely sufficient. Engineers instead evaluate distributions using means, medians, and tail percentiles such as the ninety-ninth percentile to understand how typical requests compare against the slowest outliers under load.
Shifting focus from individual user experience to broader server efficiency, system administrators evaluate performance through throughput and capacity metrics. Requests per second measures the volume of requests a server successfully completes within a specific window of wall-clock time. However, because this metric ignores the varying computational weight of individual requests, comparisons remain valid only across runs featuring identical prompt and output length distributions.
To account for the volume of data processed, tokens per second tracks the rate at which the server handles tokens across all active requests, dividing the metric into input and output forms. Workloads characterized by exceptionally lengthy prompts and brief replies can exhibit high input token throughput while generating very few output tokens, making it essential to specify which form is being evaluated.
Finally, system capacity is frequently captured through the concept of goodput, which measures the rate of successfully completed requests that satisfy predetermined service-level objectives. Rather than merely counting completed work, goodput establishes strict latency ceilings for initial token delivery, token generation intervals, and end-to-end duration. A request counts toward goodput only when it successfully meets every specified constraint simultaneously. Consequently, goodput never exceeds the standard requests per second, with the delta between the two figures representing the proportion of requests that failed to clear performance thresholds. By integrating these diverse metrics, technical teams gain a holistic view of LLM inference performance, enabling them to optimize infrastructure and deliver robust, responsive artificial intelligence applications.