











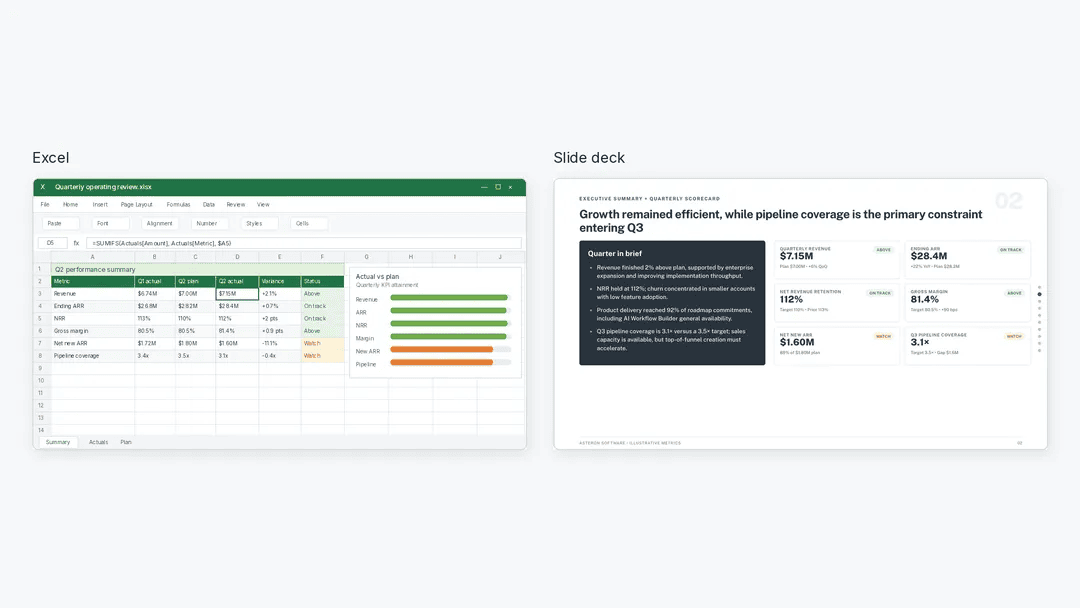
Transforming raw spreadsheet data into a polished executive presentation has long been a notorious bottleneck for business analysts, marketers, and corporate strategists. Even when the underlying numbers are fully compiled and verified, the subsequent workflow requires choosing the most impactful metrics, drafting compelling slide copy, and formatting visuals to an acceptable standard for leadership teams or external clients. This manual friction often transforms a straightforward quarterly review into an arduous, multi-hour administrative task.
Recent developments in artificial intelligence, however, are beginning to alter this landscape. Platforms like Julius’s AI presentation maker are now capable of ingesting raw spreadsheet formats such as Excel or CSV files and automatically generating editable PowerPoint decks. Yet, industry experts caution that for complex, data-heavy reporting, relying on a single, catch-all prompt to produce a finished deck can lead to oversimplified or misleading narratives. A more disciplined, methodical approach—treating the AI as a collaborative analyst rather than an autonomous generator—is increasingly seen as the most reliable way to maintain data integrity while drastically reducing production time.
To understand how this hybrid workflow functions in a real-world corporate setting, consider a standard quarterly marketing performance review. Analysts frequently face the challenge of explaining revenue fluctuations to leadership while simultaneously preparing the groundwork for upcoming budgetary allocations. Rather than issuing a vague directive to summarize performance, effective reporting begins by defining the precise business questions the presentation must answer. In this hypothetical scenario, the executive team needs to understand how revenue shifted over the course of two consecutive quarters and which underlying channels require closer scrutiny before next quarter’s budget is finalized.

Modern analytics tools allow professionals to upload complete workbooks and query multiple sheets simultaneously by specifying exact tab names rather than leaving data selection to chance. Best practices suggest initiating the workflow with a rigorous data-checking phase. Rather than requesting slides immediately, analysts can instruct the AI to read workbook notes, inspect specific revenue and advertising spend tabs, confirm reporting periods and units, and flag missing values, anomalies, or duplicate records. Crucially, the AI can be instructed to keep reference calculations separate from active source data to prevent accidental double-counting, establishing a reliable foundation before any slide generation begins.
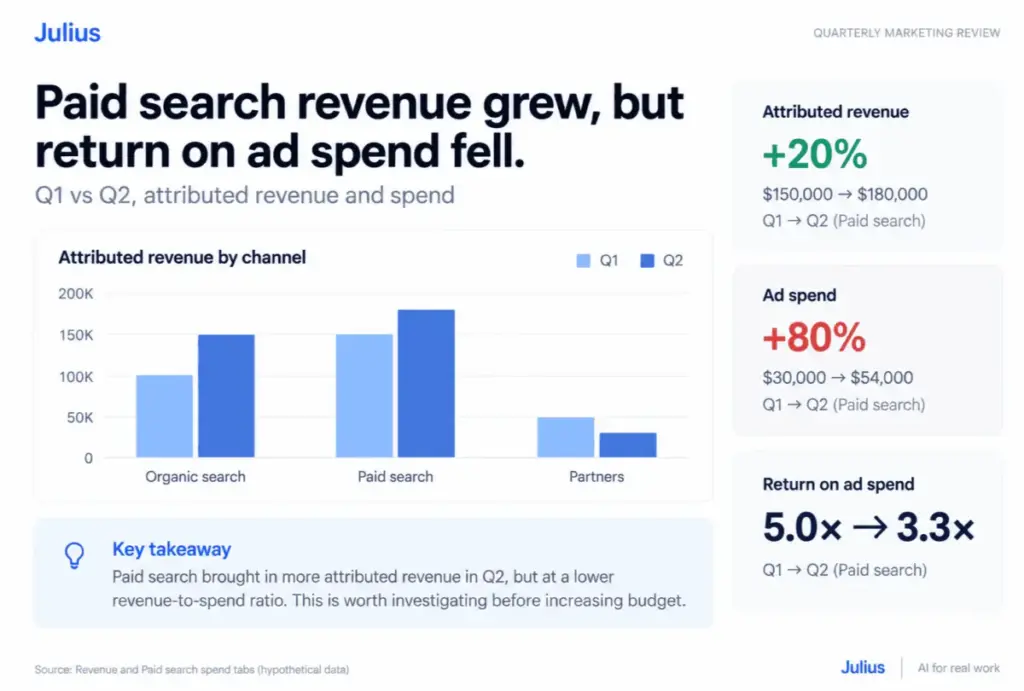
In a sample quarterly review analyzing performance across organic search, paid search, and partnership channels, meticulous verification reveals critical nuances that a surface-level summary might easily miss. Across the board, total attributed revenue grew from three hundred thousand dollars in the first quarter to three hundred sixty thousand dollars in the second quarter, representing a solid twenty percent increase. Breaking down these figures demonstrates that organic search contributed fifty thousand dollars to the overall growth, while paid search added thirty thousand dollars, and partnerships experienced a twenty thousand dollar decline.
However, a deeper inspection of advertising expenditures complicates the narrative around paid search performance. While attributed revenue for paid search climbed by twenty percent from one hundred fifty thousand dollars to one hundred eighty thousand dollars, the media spend required to achieve that growth surged by eighty percent, escalating from thirty thousand dollars to fifty-four thousand dollars. Consequently, the return on ad spend fell noticeably from five-fold to approximately 3.3-fold. A presentation slide that merely reported a twenty percent rise in paid search revenue would overlook a vital strategic insight: the channel generated more top-line revenue, but at a markedly diminished efficiency ratio.
Recognizing these distinctions prevents leadership from making uninformed decisions based on incomplete metrics. Because the source workbook lacks comprehensive margin data and cost metrics for organic and partnership channels, the analysis stops short of declaring any single channel definitively profitable. Instead, it equips the executive team with precise, verifiable questions to investigate before committing additional capital to paid advertising.
Once the underlying calculations have been rigorously verified by the analyst, the process transitions to briefing the AI presentation generator. Rather than granting the system creative license over the narrative, the user provides a detailed brief outlining the specific audience, meeting duration, verified findings, and inherent limitations of the data. Effective prompts specify the required visual formats, such as grouped bar charts comparing revenue by channel alongside supporting tables for return on ad spend, while demanding clear currency labels and reporting periods.
Furthermore, users can dictate structural constraints, requiring concise slides with takeaway titles, explicit source notes, and strict adherence to verified numbers without fabricated forecasts or inferred benchmarks. Design preferences, such as brand-specific color palettes and consistent layouts, can also be integrated into the initial instructions or refined through subsequent follow-up requests.
The final phase of the workflow emphasizes rigorous human oversight following the export of the PowerPoint file. Industry practitioners stress the importance of downloading and reviewing the actual presentation deck rather than relying solely on web-based previews. This final review ensures that financial totals remain consistent, chart labels are legible, slide titles accurately reflect the underlying data, and source annotations have survived the export process intact. Should any element require adjustment—such as ensuring both revenue and spend increases for paid search are clearly visible without overstating profitability—targeted follow-up prompts allow the analyst to fine-tune the deck before it reaches executive stakeholders. By combining the speed of artificial intelligence with rigorous human verification, professionals can significantly reduce the friction of corporate reporting while maintaining absolute confidence in the accuracy of their presentations.